Fisheries Overview and Infrastructure in Bor and Terekeka, South Sudan
A presentation on the fishery activities and infrastructure in Bor and Terekeka, South Sudan, with a focus on key findings, post-harvest losses, interventions, and the way forward. The overview includes information on fishing gears, main fish species, fish products, markets, data collection processes, and the poor state of fisheries infrastructure in the region. Insights are provided on locations, activities, stakeholders, and observations, aiming to address food security issues relating to post-harvest losses and improve the livelihoods of fisher communities.

Uploaded on Sep 29, 2024 | 0 Views
Download Presentation

Please find below an Image/Link to download the presentation.
The content on the website is provided AS IS for your information and personal use only. It may not be sold, licensed, or shared on other websites without obtaining consent from the author. Download presentation by click this link. If you encounter any issues during the download, it is possible that the publisher has removed the file from their server.
E N D
Presentation Transcript
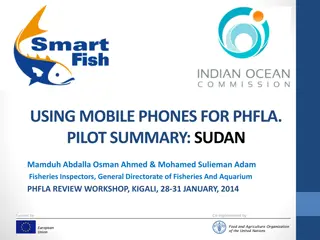
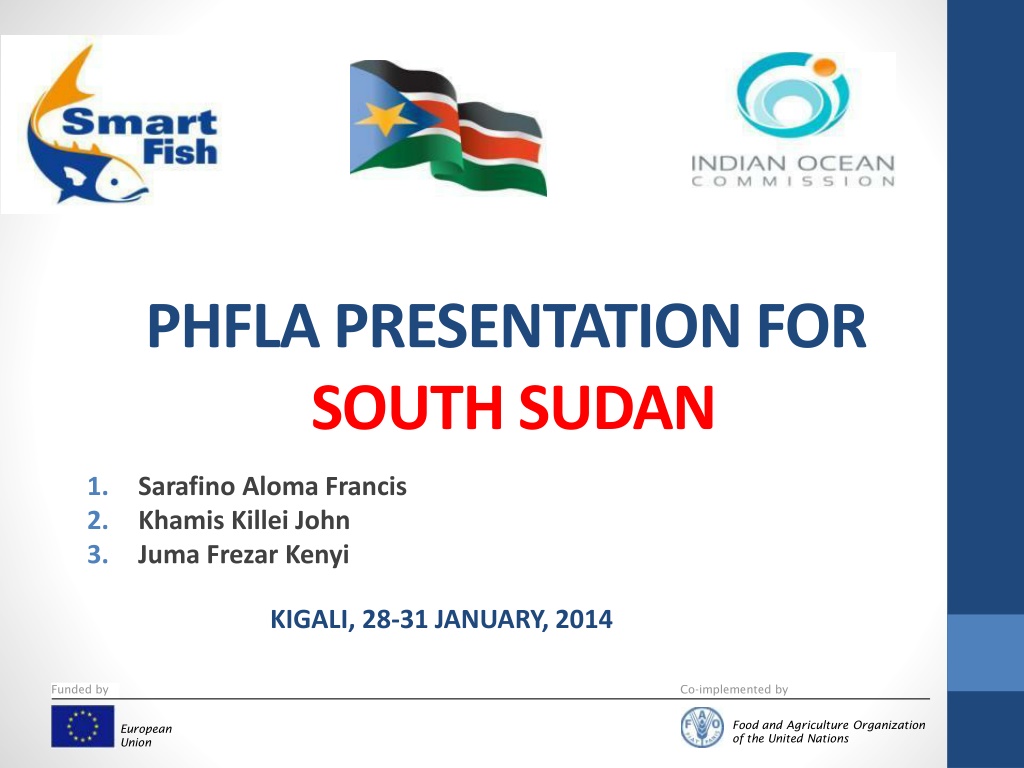
PHFLA PRESENTATION FOR SOUTH SUDAN 1. 2. 3. Sarafino Aloma Francis Khamis Killei John Juma Frezar Kenyi KIGALI, 28-31 JANUARY, 2014 Funded by Co-implemented by Food and Agriculture Organization of the United Nations European Union
OUTLINE OF THE PRESENTATION BACKGROUND INFORMATION OVERVIEW OF LOCATIONS & DATA COLLECTION KEY FINDINGS INFRASTRUCTURE ACTIVITIES AND STAKEHOLDERS POST-HARVEST LOSSES OBSERVATIONS INTERVENTIONS WAY FORWARD
OVERVIEW OF FISHERY & LOCATIONS BOR AND TEREKEKA ARE MAJOR AREA WITH FISHERIES RESOURCES. MAIN FISHING GEARS: GILLNET, CAST NET, HAND AND LONG LINES, SPEARS, TRAPS PLANKED AND DUGOUT CANOES ARE USED FOR FISHING BUT OUT BOAT MOTORS ARE USED FOR TRANSPORT FISH PRODUCTS. MAIN SPECIES: HETEROTIS (HETEROTIS NILOTICUS), TILAPIA (OREOCHROMIS NILOTICUS) , NILE PERCH (LATES NILOTICUS), CAT FISH, GYMNARCHUS (GYMNARCHUS NILOTICUS), MORMYYRUS, KRAISH (DISTICHOTUS SSP), ALESTES SPP. FISH PRODUCTS: FRESH FISH, DRIED AND SALTED DRIED FISH, SMOKED FISH. MAIN MARKETS: TEREKEKA FISH MARKET BOR FISH MARKET FISH MARKET IN BIG TOWNS (JUBA, MALAKAL, WAU)
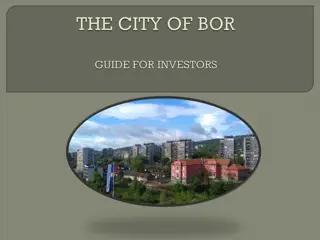
LOCATION MAP Bor area
DATA COLLECTION PROCESS DATE LOCATION ACTIVITIES (July 2013) Group meeting, interview , recording and sending data 26th Jarwong Group meeting, interview, recording and sending data 27th Lowdiar Group meeting, interview with fisher fork, recording and sending data 28th Akwak 28th Terekeka Travel and meet authority 29th Santoro Group meeting, filling forms and entering data 29th Mamonu Group meeting, filling forms 30th Terekeka Market Group meeting, recoding data 31st Juba Arrival to Juba and sending data
INFRASTRUCTURE One picture of infrastructure filled all places of photos in the form. Fisheries infrastructures (landing sites, markets facilities ) are very poor. Bor uses additional camera due to setting of mobile phone..
INFRASTRUCTURE Lawdiar landing site Jarwong landing site Akwak
Form 1: Jarwong Landing Site LOCATION NAME: Jarwong PRIORITY OF ACTIVITES (1--5) SPECIES/ PRODUCTS AFFECTED BY PHL FOOD SECURITY (1-5) NO. OF PEOPLE AFFECTED PHFL VOLUME PHL WOMEN % ACTIVITY % Fresh/ Tilapia, Fresh Nile perch, Cat fish, Heteroties Landing 30 5 216 2 60 2 1 Catfish, smoked whole, Heteroties Processing 10 2 96 2 80 2 2 Fresh/ Tilapia, Fresh Nile perch, Heteroties Retail 20 4 120 3 40 3 3
Form 1: Lawdiar Landing Site LOCATION NAME: Lawdiar PRIORITY OF ACTIVITES (1--5) SPECIES/ PRODUCTS AFFECTED BY PHL FOOD SECURITY (1-5) NO. OF PEOPLE AFFECTED PHFL VOLUME PHL WOMEN % ACTIVITY % Fresh/ Tilapia, Fresh Nile perch,Heter oties, cat fish Landing 40 10 672 2 10 2 1 Catfish, Sundried (Unsalted) whole Processing 10 3 36 2 70 3 2 Fresh/ Tilapia, Fresh Nile perch,Heter oties Retail 10 2 240 2 80 2 4 Tilapia, cat fish, Heteroties Wholesale 20 2 396 3 90 2 3
Form 1:Akwak Fishing camp & Landing Site LOCATION NAME: Akwak PRIORITY OF ACTIVITES (1--5) SPECIES/ PRODUCTS AFFECTED BY PHL FOOD SECURITY (1-5) NO. OF PEOPLE AFFECTED PHFL VOLUME PHL WOMEN % ACTIVITY % Fresh tilapia, Heteroties, Cat fish, Nile perch Landing 70 15 556 2 0 2 2 Fresh/ Tilapia, Nile Perch, Heteroties, Cat fish Fishing 42 10 454 2 0 3 1 Clarias, Sundried (Unsalted) & Clarias Processing 20 3 72 1 90 2 4 Fresh Tilapia, Heteroties, Cat fish, Nile perch Wholesale 8 1 30 1 0 1 3
FORM 1 : Santoro LOCATION NAME: Santoro PRIORITY OF ACTIVITES (1--5) SPECIES/ PRODUCTS AFFECTED BY PHL FOOD SECURITY (1-5) NO. OF PEOPLE AFFECTED PHFL PHL % WOMEN % ACTIVITY VOLUME Tilapia /smoked whole Fishing 4 4 3 1 0 1 5 Cat fish /smoked whole Processing 4 4 5 3 0 3 2
FORM 1 Momonu LOCATION NAME: Momonu PRIORITY OF ACTIVITES (1--5) SPECIES/ PRODUCTS AFFECTED BY PHL FOOD SECURIT Y (1-5) NO. OF PEOPLE AFFECTED PHFL PHL % WOMEN % ACTIVITY VOLUME Tilapia /whole fresh Fishing 19 19 11.76 3 0 4 1 Nile perch / whole fresh Landing 19 19 12 2 0 1 3 Cat fish /smoke whole Processing 19 19 7 4 0 3 2
FORM 1 Terekeka Market LOCATION NAME: Terekeka Market PRIORITY OF ACTIVITES (1--5) SPECIES/ PRODUCTS AFFECTED BY PHL FOOD SECURITY (1-5) NO. OF PEOPLE AFFECTED PHFL PHL % WOMEN % ACTIVITY VOLUME Clarias and Bagrus ssp/ fresh and smoked Retail 18 10 35 4 10 2 1
TOTAL LOSS VALUE % OF RESPONDENTS 35 Akwak 30.3 30.2 Akwak 30 Akwak Akwak 24.1 25 Jarwong Total loss value % Jarwong 20.1 20 Jarwong 18.1 17.4 Lawdiar 15.3 13.6 15 Lawdiar 13.2 13.3 Mamuno 10.7 10 Santuro/ Makue 8.3 7.9 Terekeka Market 4.6 Terekeka Market 5 Terekeka Market 0 Locations
AVERAGE TOTAL LOSS VALUE % PER SITE 30 24.1 25 Akwak (n=4) Jarwong (n=3) 20.4 Lawdiar (n=3) 20 Average total loss value (%) Mamuno (n=1) Santuro/ Makue (n=1) 15.3 Terekeka Market (n=3) 15 13.3 13.6 10.17 10 5 0 Locations
ANNUAL VALUE TOTAL LOSS (LOCAL CURRENCY) PER SITE 1000000 947576.7 900000 800000 Annual total value loss (Local currency) Anuual total value loss per site (Local Currency) 700000 600000 489661.3 500000 400000 282798.3 300000 200000 59253.33333 100000 43776 8640 0 Akwak (n=4) Jarwong (n=3) Lawdiar (n=3) Mamuno (n=1) Santuro/ Makue (n=1) Terekeka Market (n=3) Locations
ANNUAL VALUE TOTAL LOSS (US $) PER SITE 700.0 613.7 600.0 500.0 Annual total value loss Annual total value loss per site (US $) 400.0 317.1 300.0 183.2 200.0 100.0 38.4 28.4 5.6 0.0 Lawdiar (n=3) Jarwong (n=3) Mamuno (n=1) Santuro/ Makue (n=1) Terekeka Market (n=3) Akwak (n=4) Locations
PHYSICAL LOSS (%) OF RESPONDENTS 12 1- Akwak 2- Akwak 3- Akwak 4- Akwak 10 10 5- Jarwong 6- Jarwong 7- Jarwong 8.3 8 Physical loss (%) 6.7 6.7 8- Lawdiar 9- Lawdiar 10- Lawdiar 6 5.6 6 5 5 11- Mamuno 4.2 4 3.3 3.3 12- Santuro/ Makue 13- Terekeka Market 14- Terekeka Market 15- Terekeka Market 1.7 2 0 0 0 0 1 2 3 4 5 6 7 8 Locations 9 10 11 12 13 14 15
AVERAGE PHYSICAL LOSS (%) PER SITE 9 8 7.65 7 Average physical loss (%) 6 Akwak (n=4) 4.8 Jarwong (n=3) 5 Lawdiar (n=3) 3.9 Mamuno (n=1) 4 Santuro/ Makue (n=1) 3.1 Terekeka Market (n=3) 3 2 1 0 0 0 Locations
CAUSES OF LOSS TERKEKA MARKET CAUSES JARWONG LAWDIAR AKWAK MAMUNO SANTURO Fish in nets or on hook for look time Yes Yes Yes Yes No No Lack of adequate ice and chilling facilities Yes Yes Yes Yes Yes No Poor packing/ handling Yes Yes Yes No No Yes Yes Yes No No No No Physical damage Rain or bad weather Yes No No Yes Yes Yes Yes No No No Yes No Spoilage Poor storage facilities No Yes Yes No Yes Yes No market/ buyers No No Yes No No Yes No Yes Yes Yes Yes No Delay
DATA COLLECTION: OTHER OBSERVATIONS Post harvest loss increases northwards of the assessed areas Fisheries infrastructures (landing sites ,markets facilities) are very poor Mobile phone setting could not take 5 different pictures at a given location because one photo fills all spaces Mobile Network did not save the location and sending data in Terekeka No access road leading to some Site Whole sale Fish traders buys fresh fish directly from the fishing sites daily thus reducing post harvest loss
INTERVENTION IDEAS HOW WHO WILL BENEFIT/TARGE T GROUP PROPOSED INTERVENTIONS PHL THAT WILL BE REDUCED WHAT ARE THE LIKELY BENEFITS MANY WILL BENEFIT APPROXIMATE BUDGET/COST Construction of landing site with storage facilities Quality loss of whole fresh fish Fishermen, Consumers & Government Better quality, more income 500 1,800,000 SSP Training of fisher folks in fish handling and processing High nutrition value and generate more income Fishermen & Processers Quality and physical loss 250 200,000 SSP Quality and physical loss Fish traders, Government & Consumers Construction of fish market in the city 3,000000 SSP Better quality 500 Better quality High price More income Quality loss of fresh fish Fishermen & Consumers 10,000,000 SSP Provision of ice plant 500 15,000,000 SSP Total amount required
LESSONS LEARNT & WAY FORWARD PHLA should cover more sites in future Team of PHL should be trained on basic of data analysis During process of data collection one support staff should be trained Fish folk should be trained on fish handling and processing


 OF RESPONDENTS")
 PER SITE")