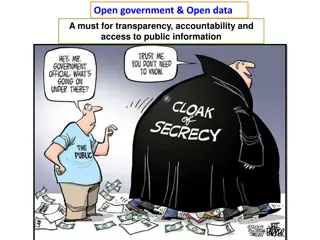
Insights into Local Government Research Activities - October 2018
Findings from a survey involving 50 respondents working in or around local government research reveal the activities, challenges, and opportunities in this sector. Responses indicate a focus on research, consultation, and policy roles, with variations between districts and other types of local authorities. Research-related activities, such as online surveys and public meetings, differ among respondents based on the nature of their work environments.

Download Presentation

Please find below an Image/Link to download the presentation.
The content on the website is provided AS IS for your information and personal use only. It may not be sold, licensed, or shared on other websites without obtaining consent from the author. Download presentation by click this link. If you encounter any issues during the download, it is possible that the publisher has removed the file from their server.
E N D
Presentation Transcript
Whats going on in local government research October 2018
What is this? The findings from a survey aimed at people working in or around local government research to share what they re doing, how they re doing it and where the opportunities and challenges are. It s obviously not a huge number, so the usual cautions to be applied to any %s reported Responses to the survey Responses to the survey 50 respondents work in a local authority. Other responses were from the Police, a housing association and some freelancers/ consultants (okay, one of these was me). 54
Biggest response came from districts, mainly in North West and South East Type of LA District County Unitary London borough Metropolitan Borough Other - shared service district n 20 11 11 3 3 1 1 Type of LA North West South East East of England North East East Midlands London West Midlands Scotland South West Wales Yorkshire and the Humber n 18 9 7 5 3 3 3 2 1 1 1 To compare some of the results by LA type, non-district respondents have been grouped as CULMB
Who responded? 0 5 10 15 20 25 30 29 of the local authority respondents are in management positions, 21 are in officer or assistant positions Manager, HoS or above 16 13 Officer or assistant 13 8 CULMB District The remaining 10 work in a range of departments, including children s services, housing and planning 40 of the 50 would describe their role as 40 corporate
What does the job cover? Most respondents wear multiple hats, the most common being research, consultation and policy 100% 90% 80% 70% 60% 50% 40% 30% Those working in districts appear less likely to identify evaluation in their job role 20% 10% 0% Research / data analysis Consultation Policy / strategy / performance Evaluation Community engagement Business intelligence / analyst Communications / PR / marketing Overall CULMB District Q6 What does your job cover?
Research-related activities in the last 12 months Range of research activities undertaken or commissioned in the last 12 months, with online surveys the most common. CULMB authorities are more likely than districts to have undertaken or commissioned a needs analysis (66% v 24%) and telephone surveys (41% v 19%). District respondents are more likely to have held public meetings (67% v 48%). Particularly for respondents in larger LAs, different research-related functions can be sat in different teams and so this may not present the full picture Q7 What research activities have you/ your team delivered or commissioned in the last 12 months?
Software and tools used in the last 12 months Similarly, respondents were most likely to indicate that they/ their team have online survey software. CULMB authorities appear more likely than districts to have GIS or mapping software (83% v 52%) and specialist data analysis software (62% v 29%). 90% 80% 70% 60% 50% 40% 30% 20% 10% 0% Online survey software GIS/ mapping Dashboards Specialist data analysis software Mobile devices for data collection Online panels/ groups/ forums Data User and data visualisation programming, eg SQL based experience testing software Q8 What types of software or tools have you/ your team used over the last 12 months?
Most popular software and tools being used Snap Surveys (18), Survey Monkey (10), Smart Survey (8) SPSS (10), Excel (10), Snap Surveys (4) Power BI (6), Tableau (3), Excel (3) Arc GIS (12), MapInfo (6), QGIS (6) Q9 Please list any specific software or tools you use.
Plans for new software and tools Around 1 in 5 respondents indicated that they or their team are likely to bring in new tools or software over the next 12 months. This rises to 3 in 5 when maybe is included. 8 of 21 district respondents indicate they will not be bringing any new tools or software in over the next 12 months. Overall 19% 43% 22% 17% CULMB 24% 45% 7% 24% District 14% 38% 38% 10% Yes Maybe No Don't know The main software and tools people are looking at bringing in are for The main software and tools people are looking at bringing in are for qual qual analysis, mapping, engagement and consultation tools and BI analysis, mapping, engagement and consultation tools and BI dashboards dashboards Q10 Are you/ your team likely to bring in any new tools or software over the next 12 months?
How surveys have been promoted and pushed 0% 10% 20% 30% 40% 50% 60% 70% 80% Council social media accounts E-newsletters and email distribution lists Online methods appear most popular for pushing public surveys. Districts are more likely to have adopted the various approaches than respondents from bigger authorities, particularly using the local press (67% v 24%). Posters and surveys available in public buildings Shared by partners Resident newsletters and magazines Public events Incentives and prize draws Articles and adverts in the local press Shared by councillors/ elected members Paid for social media adverts Not applicable/ don't know Used a panel provider Used a marketing agency Q11 What approaches, if any, have you/ your team used to promote and drive responses to public surveys and consultations in the last 12 months?
Feedback on promotion or engagement activities tended to focus on social media, online tools and partnership working Facebook Ads worked well. Facebook paid-for ads. Going into 2 local high schools gaining their support and engagement with their year groups. Closure of Council shops and libraries require a revaluation of how we get detailed information into the public domain for those who don't go online. Govdelivery has been very good. Good use made of online questionnaires. Social media can get a bit out of hand if consultation ideas not well received or understood which can impact response rates and cause bias - eg interest group creating anti- campaign to proposal. Shares on the council's Facebook and twitter page have worked well. Our Online Resident's Panel, although depleted by GDPR still provides a better response than social media. Our online portal allows us to invite registered members to take part. Social movement incentives have proved popular, for example donations to a local charity based on the number of responses. Social media shares appear to be our most successful channel. Working with schools has had an improvement in broadening the demographic response. Social media is used but needs to be more balanced and away from the facebook obsession; enhancing instagram, snapchat etc. Trying the question into a wider campaign has driven more engagement, for example rather than promoting a survey/consultation about litter, we have found that using the campaign about litter in general and then saying you can get involved through the survey/consultation has been more effective. Also using partners to engage directly with specific groups has been a powerful tools, however resourcing and managing this is a challenge. We find social media can be very effective if accompanied by an explainer video. Q12 Do you have any feedback on any promotional or engagement activities which have been particularly effective or ineffective?
Where people turn to for peer support and advice Around 7 in 10 respondents access support or advice from internal colleagues or by attending local networks/ conferences, with half attending national networks/ conferences. 70% 60% Accessing support through social media (eg Twitter, LinkedIn) is relatively low, particularly amongst district respondents 50% 40% 30% 20% 10% 0% Internal team/ colleagues Attending local networks/ conferences Attending national networks/ conferences Email groups/ networks Other online groups, eg Knowledge Hub Public sector partners Consultants or agencies LinkedIn Twitter Academic partners Other partners Facebook Q13 Have you accessed peer support or advice through any of the following over the last 12 months?
Networks, associations and memberships 0% 10% 20% 30% 40% 50% 60% More than half of respondents are a member of LARIA, although it should be noted that the survey was promoted and pushed through the LARIA network. Local Area Research & Intelligence Association (LARIA) Local Government Information Unit (LGIU) Market Research Society (MRS) The Consultation Institute Other memberships highlighted by respondents included the Royal Statistical Society, LG Inform, LGA, APSE, CCN and NLGN (that s a lot of acronyms). Not a member of any recognised associations Social Research Association (SRA) Q14 Are you or your team a member of any of the following associations?
What training or learning have people accessed? A third of respondents (18 of 54) have attended or accessed some training/ learning in the last 12 months, including: MRS Certificate in Social and Market Research, LGA Behavioural insights seminar LARIA conference Consultation Institute - law of consultation, best practice online consultation. What works network R training at Manchester Uni LARIA National Conference CACI Insite training, CFO Insights training LARIA national conference, LARIA regional conference. LARIA conference MRS Advanced Certificate Consultation institute certificate, various other courses on data visualisations and customer insight and census LARIA Annual Conference, ONS Admin data workshop households, British Society for Population Studies seminar. Data Vizualisation / Data Story Telling, Data Science, Tableau, R Software, Statistically Testing courses, Theory of Change / Logic Modelling Tableau The Law of Consultation - by the Consultation institute Q15 What training or learning have you attended/ accessed in the last 12 months?
What are people looking to learn or develop in the next 12 months? Comments relating to data science and systems data science and systems, including: development of R coding , deliver more predictive and prescriptive data science and developing more sophisticated methods, eg R, machine learning 8 Comments relating to storytelling and data vis vis, including: story telling / data impact and data visualization/ infographics storytelling and data Comments relating to learning new analysis techniques techniques, including: forecasting and qualitative data analysis learning new analysis 5 Comments relating to evaluation evaluation, including: evaluation theory and measure outcomes Comments relating to engagement including: widening demographic engagement and may have to do more on engagement engagement, 4 3 Q16 Is there anything in particular you/ your team are looking to learn or develop skills/ knowledge in over the next 12 months?
Biggest challenges relate to capacity and resource Comments relating to capacity and resource still trying to meet previous demand and capacity - both to conduct the research but also for the service/operational end to digest and engage capacity and resource, including: lack of time and resource but 20 Comments relating to lack of skills or development or development, including: not having the skills, knowledge, hard- and software to help me do the job properly lack of skills Comments relating to value or focus of research in the research in the organisation organisation, including: lack of appreciation of how data research/ analysis can help the organisation value or focus of 7 8 Comments relating to legislation and policy legislation and policy, including: GDPR and volume of statutory consultations required Comments relating to data quality data quality and equality of data quality, reliability of anecdotal evidence data quality, including: 5 4 Q17 What would you say has been the biggest challenge for you/ your team over the last 12 months?
Biggest opportunities relate to how research could be used in the organisation Comments relating to increased value of research in the increased value of research in the organisation recognition of evidence based working , increased awareness of the research team and more receptiveness to methods and tools to support training, research and consultation organisation, including: 7 Comments relating to digital including: better use of digital for engaging with residents and new technologies, digital development digital, Comments relating to software and systems systems, including: interactive mapping system and making use of free software like R software and 6 6 Comments relating to income generation generation, including: expanding our portfolio of clients and new opportunities to undertake paid- for work for other organisations income Comments relating to staffing and restructures restructures, including: being able to hire more staff soon and if we can do it, getting an analyst added to the team staffing and 5 4 Q18 What would you say is the one biggest opportunity for you/ your team in the next 12 months?
Some examples of projects that have gone well Local community profiles with the VCS infrastructure provider to help support local bids with evidence. Everyone was on the same page Project involved public perception of experiences of crime. There were partner organisations involved and a really good number of surveys completed and returned. Development of sub-district population forecast model to support long term school provision planning, as this has led to use of approach to support wide range of other projects Improving life chances for people in a local deprived area. Started with an idea and data to set the scene then gathered momentum and support from many orgs and cllrs and it's now making real differences. Visualising data with Power BI. Went well as I could manage the workload and learn how to develop things using reports, online courses, etc Consultation on future of the city's Parks and Allotments - good partnership between ourselves and the University's OpenLab to deliver mixed methods consultation, online and workshops Health and Social Care Transformation - my team were engaged in the end to end process which meant that the role of evidence was recognised throughout, and that research/analysis techniques could directly help the process rather than just being seen as a add-on Review for the LGA on issues, challenges & good practice from LAs in becoming intelligent organisations. Went well because those I spoke to want this to happen (& so learn from others). Establishment of a new rolling survey fieldwork process of gathering data on tourism - multiple skillsets, appropriate solution to a data need Q19 Please give one example of a project you have been involved in which went particularly well.
Some examples of projects that didnt go so well Care leave accommodation strategy due to poor data quality and difficulties agreeing assumptions with service for the forecasts model, with also tension between central analytics team and local management information team over who should do the work. Mandatory project on changes to Council Tax relief. There was a lot of supplementary material and high amount of questions which resulted in a very poor number of responses. Several - mainly because of lack of engagement of partners in other organisations We knew that our old method of telephone based sample survey was no longer the tool of choice for most of our residents, and we wanted to find a way to have a more open dialogue with residents and stakeholder. However, the challenge we have is finding the balance between statistical confidence (which things like telephone surveys can deliver) and flexible / open dialogue (which is generally not following a clear statistical method) There are always challenges in presenting results General data quality issues particularly around social care. Massive demand for intelligence to inform decisions but the data isn't in the right shape Study where level of delegation was too high - I've done many projects in the past without requiring a line manager to be 'project manager . Broader area profiles with consumer profiling system. A great deal of work done on the promise from provider that derivative analysis was ours to keep, which they then legally required us to delete when our contract came to an end. Staff parking - the objectives were not made clear and it was extremely rushed therefore the questions were not critiqued and did not fully capture the intelligence required to present any meaningful information. We have sometimes encountered difficulty getting feedback which is specific to what is being consulted on, rather than about the general topic (i.e. "what form should services to tackle obesity take?", rather than "What are your personal views on why some people are obese?") Q20 Please give one example of a project you have been involved in which didn t go as well.
Whats interesting people Government data science accelerator program - want something like this more locally! "Essex Data have done some interesting work around joining up data to tackle issues earlier: http://www.essexfuture.org.uk/in novation/data-and-digital/essex- data-programme/ The Data Science Institute (part UoM part RSS part others) has been bringing together some brilliant people and some exciting projects. In one way this is a million miles away from public sector sector focus and seen as something done in more the commercial sector, but in another I've found it a brilliant way to think how mew methods and approaches could be applied to public sector challenges. Produced outcome based performance monitoring information against our corporate plan - http://fyldeperformance.in phase.com Use of population data at ward level, analysis of voter turnout and registration rates in the May 2018 local elections. (Barry Fong, GLA) Homelessness Prevention Trailblazer multidisciplinary team at Newcastle City Council Like some of the stuff being done in Redbridge and Stockport. Also GM Analysts and MappingGM. Worth talking to Essex about data in general, and some predictive analysis work that I've only seen at a headline level in Southwark and Greater Manchester (homelessness and children at risk, respectively). Essex workshop at LARIA Annual Conference and also Wirral presentation Essex data. Q21 If you ve seen something interesting or impressive being delivered somewhere else, please share.
Challenges all comments Balancing increased demands on time to do the 'day job' with the need to upskill and keep up-to-speed with new techniques and technology. Building capacity in council 'service areas' to carry out low level research and engagement Capacity - both to conduct the research but also for the service/operational end to digest & engage, especially when there is so much integration through reform, meaning that most projects overlap. Capacity - our team has been reduced from 7 people (10 years ago) to 1.5 people now. Capacity in shrinking budgets Capacity. Changes to datasets by central government. Data protection changes Data quality Demonstrating the value of BI to a leadership team who don't have data backgrounds. Ensuring evidence base for local plan is appropriate and up to date, also wide consultation, backed up by clear mapping Equality of data quality. Reliability of anecdotal evidence. Confidence that all voices are being heard. Finance! How to predict and influence demand on council services Implementing new system & gaining buy in for all service areas. Internal culture change Keeping up with delivering the survey projects that we get paid for as we work as a mini-agency providing support for parish, town and district councils Lack of appreciation of how data research/analysis can help the organisation, and consequently, a lack of enthusiasm and support for this work. Lack of resource and time but still trying to meet previous demand. Lack of resource, recognition of the importance of intelligence by local authority. Lack of resources - we have lost three members of staff who have not been replaced (two are left) Lack of specialist analytical skills in a disticit council environment. Lack of time available to read/train/develop due to a combination of reduced staff numbers and increasing workload. Lack of unique identifiers between different data sets e.g. housing, benefits and health Limited capacity versus increasing demand for business intelligence Maintaining the organization's understanding of the importance of data quality in the face of cuts and staff departures Moving from tactical / operational research to research that will inform strategic priorities. new to the role so just understanding the legal requirements and LGA inform requirements Not having enough staff, or a clear direction for the team. Not having the skills, knowledge, hard- and software to help me do the job proplerly Online survey fatigue, GDPR, finding the right people with the right skills in our area to fill vacancies. Reduced resource due to austerity Resource and coordination. Consultation needs to be an initial thought and is often considered later in a project rather than at the planning stage. When it is required it is sometimes rushed and therefore not maximising the gains to be had by planning it thoroughly. Another couple of challenges: as many of us in LAs have a number of roles and sometimes quite diverse research and intelligence sourcing/ mapping around themes can be difficult despite there seeming to be more info available to us all! I am talking about local data. Also the level of analysis we can do in-house is limited and on smaller projects we would not be inclined to commission a research company. Deeper analysis of results would be beneficial and this isn't always possible with the resources/ tools we have ie excel Restructures taking capacity and making it feel more stressful! Social mobility Staffing reductions - The general lack of creativity and innovation within the sector; and the bigger issue that the sector fails to acknowledge its severe limitation in this area. - Ensuring the data captured can be translated into usable insight within a relatively short time frame - Bizarrely whilst there is a range of wider data about the demographic inequalities we still think its important to have an older persons strategy rather than one aimed at tackling the very real issues faced by younger demographic groups. I'm writing this as someone in the "older" group as well!!!! The volume of statutory consultations required, without a specific research team. Ensuring quality consultation is carried out avoiding risk to the council (reputation and legal challenge). Time for thorough user research
Opportunities all comments Automating what are currently manual processes Being able to hire more staff soon better us of digital for engaging with residents and allowing the delegation of simple survey work across the organisation Broad use of research findings Community engagement is an emerging field for us Developing a new data science led BI function as part of a new council operating model. Expanding our portfolio of clients Exploit technology to automate data processing activity to reallocate resource to higher value analytics Exploring the potential of visual media to increase participation. If we can do it, getting an analyst added to the team Improvements of availability of local data Increased awareness of research team and willingness to commission/take note of strategic products Interactive mapping system - lower geography insight - capturing the younger (under 40s) views and starting to actively use this in shaping data Making use of free software like R More focus on community engagement and development as we have set up as a new team and therefore it is hoped that there will be more receptiveness to methods and tools to support training, research and consultation. new opportunities to undertake paid-for work across other organisations New system New technologies, digital development Recognition of evidenced based working - there is a really strong appetite to see evidence informing policy which has empowered my team to push boundaries, learn new skills, and try new things, in order to answer the hardest questions. However, this also is part of the reason for the challenges. Shifting from traditional customer interactions / methods to digital transactions Social media Social media Supporting innovation Taking on consultations for other local authorities The establishment of a new system wide Office of Data and Analytics Trading We are finally restructuring, and should hopefully have a clearer team vision and three new members of staff.
Projects that went well all comments Development of sub-district population forecast model to support long term school provision planning, as this has led to use of approach to support wide range of other projects Engagement project to re-imagine our library service Establishment of a new rolling survey fieldwork process of gathering data on tourism - multiple skillsets, appropriate solution to a data need Health and Social Care Transformation - my team were engaged in the end to end process which meant that the role of evidence was recognised throughout, and that research/analysis techniques could directly help the process rather than just being seen as a add-on. This mean: producing demand analysis to illustrate the context for initial thinking about new ways of working; then supporting services to develop new business cases using Theory of Change and Cost Benefit tools; then supporting the central policy by testing the impact of the business cases using modelling techniques and Cost Benefit Analysis; then building an evaluation framework that properly tested the impact of the business cases; and now starting to implement parts of the evaluation framework to test impact. Improving life chances for people in a local deprived area. Started with an idea and data to set the scene then gathered momentum and support from many orgs and cllrs and it's now making real differences. Local community profiles with the VCS infrastructure provider to help support local bids with evidence. Everyone was on the same page. Parks consultation on future of the city's Parks and Allotments - good partnership between ourselves and the University's OpenLab to deliver mixed methods consultation, online and workshops Project involved public perception of experiences of crime. There were partner organisations involved and a really good number of surveys completed and returned. Repairs analysis gave great insight into highest areas of service use and cost Report with colleagues from ADP and NHS examining overprovision Residents' Survey - continual resourcing of our biennial survey collecting longitudinal data. Review for the LGA on issues, challenges & good practice from LAs in becoming intelligent organisations. Went well because those I spoke to want this to happen (& so learn from others). Scrutiny in-depth review of potential health inequalities in the Borough. It raised awareness of the breadth of impact district authority services have on the wider determinants of health. Self-sufficiency internal created projects, which has led to efficiency or cost saving gains SHMA - lots of interest This is internally related to our colleague survey. 90%+ response rate, run over for weeks. Wealth of insight in differences between divisions; age, length of service, but interesting very little difference in gender Town centre car parking survey - from an operational perspective it was dealt with as a project. The team included engineers , communications and engagement members and volunteer coordinator and through a planned approach and marketing it went well. The aid of volunteers really helped the project. Visualising data with Power BI. Went well as I could manage the workload and learn how to develop things using reports, online courses, etc.
Projects that didnt go so well all comments Anything to do with technical changes to council tax reductions. Whilst important and a need to consult, very dry and technical and no real desire/ effort to promote = poor response. Also, general data quality issues particularly around social care. Massive demand for intelligence to inform decisions but the data isn't in the right shape. Broader area profiles with consumer profiling system. A great deal of work done on the promise from provider that derivative analysis was ours to keep, which they then legally required us to delete when our contract came to an end. Care leave accommodation strategy due to poor data quality and difficulties agreeing assumptions with service for the forecasts model, with also tension between central analytics team and local management information team over who should do the work I wasn't involved in the Phase 1 survey where paper survey was sent out to 43,000 houses, data inputting time consuming, caused significant project delays. I've since been asked to pick up this work to design timely research solution for phase 2. Mandatory project on changes to Council Tax relief. There was a lot of supplementary material and high amount of questions which resulted in a very poor number of responses. Re-producing a new website fit for purpose for payment integrations Resident Engagement - we knew that our old method of telephone based sample survey was no longer the tool of choice for most of our residents, and we wanted to find a way to have a more open dialogue with residents and stakeholder. However, the challenge we have is finding the balance between statistical confidence (which things like telephone surveys can deliver) and flexible / open dialogue (which is generally not following a clear statistical method). This is both a technical and process/behaviours challenge for us, which we've not completely resolved yet. Several - mainly because of lack of engagement of partners in other organisations Staff parking - the objectives were not made clear and it was extremely rushed therefore the questions were not critiqued and did not fully capture the intelligence required to present any meaningful information. Study where level of delegation was too high - I've done many projects in the past without requiring a line manager to be 'project manager'. There are always challenges in presenting results We have sometimes encountered difficulty getting feedback which is specific to what is being consulted on, rather than about the general topic (i.e. "what form should services to tackle obesity take?", rather than "What are your personal views on why some people are obese?") Wider public consultation on the corporate plan. 3000+ responses within a 4 week survey. A number of significant strides forward, and much improved demographic response. However not as big a step change as might have been hoped. Remained too obsessed with facebook as a social media tool, although gathered a lot of myth busting data; school engagement haphazard, delaying communication to coincide with half term was obviously not going to generate the early impetus, but this did not occur to that element of the project team; employer engagement a non starter as not enough engagement with and buy in from the eco dev team.