Comprehensive Overview of ITP Planning and Operation Relationships
Detailed exploration of the interconnected aspects of ITP planning and operations, including reliability analysis, economic assessment, consolidated planning processes, entry fee approaches, alignment of assessments, various types of CPP studies, and study phases and assessment types. The content covers a wide range of topics critical to effective energy management and infrastructure planning.

Download Presentation

Please find below an Image/Link to download the presentation.
The content on the website is provided AS IS for your information and personal use only. It may not be sold, licensed, or shared on other websites without obtaining consent from the author. Download presentation by click this link. If you encounter any issues during the download, it is possible that the publisher has removed the file from their server.
E N D
Presentation Transcript
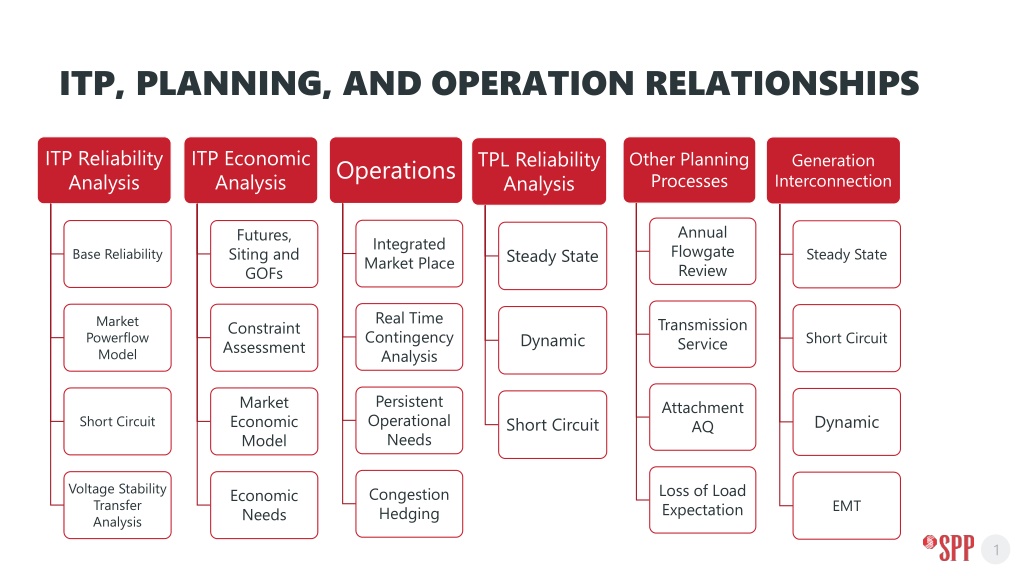
ITP, PLANNING, AND OPERATION RELATIONSHIPS ITP Reliability Analysis ITP Economic Analysis TPL Reliability Analysis Other Planning Processes Generation Interconnection Operations Annual Flowgate Review Futures, Siting and GOFs Integrated Market Place Steady State Steady State Base Reliability Real Time Contingency Analysis Market Powerflow Model Transmission Service Constraint Assessment Short Circuit Dynamic Persistent Operational Needs Market Economic Model Attachment AQ Dynamic Short Circuit Short Circuit Voltage Stability Transfer Analysis Loss of Load Expectation Congestion Hedging Economic Needs EMT 1
CONSOLIDATED PLANNING PROCESS CONSOLIDATED PLANNING PROCESS ENTRY FEE APPROACH ENTRY FEE APPROACH Regional Assessment Becomes Entry- Fee maintenance Becomes sub- regional cost allocation estimation instead of an actual portfolio 2
ENTRY-FEE AND ASSESSMENT ALIGNMENT Regional (CPP) Assessment Reliability & Economic Assessment Initial Long Term Economic Assessment Assessment ERIS/CRIS Assessment 3
TYPES OF CPP STUDIES Study CPP Study Assessments Performed Models Long-Term Forward Casting Horizon (11-20 years) Study 1 Economics Year 15, 20 Futures, Siting and GOFs Constraint Assessment Market Economic Model Economic Needs Long Term/Annual - Planning Horizon (2 10 years) Study 1, 2, & 3 Reliability Economics Year 2, 5, 10 Base Reliability Market Powerflow Model Short Circuit Voltage Stability Transfer Analysis Persistent Operational Needs Futures, Siting and GOFs Constraint Assessment Market Economic Model Economic Needs Persistent Operational Needs 4
STUDY PHASES ASSESSMENT TYPES Study Initial Services Reliability Assessment Phase (2 10 years) ERIS CRIS Reliability with ERIS thresholds Steady-State (ERIS Only) Short Circuit (ERIS + CRIS) Stability (ERIS + CRIS) Reliability with CRIS thresholds Steady-State Regional (CPP) Assessment Phase (2 10 years) Reliability Economics Steady-State Market Powerflow Model Short Circuit Voltage Stability Transfer Analysis Persistent Operational Needs Futures, Siting and GOFs Constraint Assessment Market Economic Model Economic Needs Persistent Operational Needs 5
PURPOSE & SCOPE Item CRIS ERIS Provide deliverability to loads located within the same deliverability area by customer elected conversion to long term firm service without additional studies Ensure delivery of the Generating Facility's electric output using the existing firm or non- firm capacity of the Transmission Provider s Transmission System on an as available basis Purpose Base Model Capacity (e.g. ITP BR) Models or Energy (e.g. MPM) Models Study Dispatch Based on ERIS or CRIS flow gate methodology Base Model: Selection comes down to how similar to the market dispatch we want to consider for the starting point 6
STEADY STATE DISPATCH SCOPE Study Model ERIS CRIS Source: Single ERIS GEN + Common impacting ERIS GENs Sink: SPP footprint Gen: Single CRIS GEN + Common impacting CRIS GENs based Sink: Scale to all NITSA in the same DA Steady State Dispatch 5% and up to 100% of CRIS Service Amount Inclusion of impacting gens 25% and Unit Category Transmission constraint identification Based on HITT T1 ERIS threshold study? 3% 25% and 5% provide separation on type of services 7
CPP GI ERIS POWERFLOW DISPATCH Unit Category Conventional Conventional Conventional Renewable Conventional Operating Function Conventional Conventional Conventional Renewable Fuel Type Combined Cycle Combustion Turbine Diesel Engine Hydro Nuclear Storage Coal Oil Waste Heat Wind Summer Peak 100% 100% 100% 50% 100% TBD 100% 100% 100% Historical Performance 100% Winter Peak 100% 100% 100% 50% 100% TBD 100% 100% 100% Historical Performance 100% Light Load 0% 0% 0% 100% 100% TBD 0% 0% 0% 100% Renewable Solar 0% 8
FLOW GATE METHODOLOGY Step 0: Step 0: Start with the existing base model dispatch Step 1: Step 1: Dispatch one current study generator based on enhanced fuel type dispatch Step 2: Step 2: Identify transmission flowgates (mon/con) overloads observed by the current study generator Step 3: Step 3: Identify and dispatch up alike (category, fuel type) generator based on the new grouping definition 9
STEP 1 Existing Transmission Northeast ND Light Load 100% W L offline 2 3 Load Projections BM % L W W 1 9 C Current Study Wind Gen Current Study Solar Gen W offline L 11 12 13 L S 10 L Current Study Solar Gen W S Offline C Offline L 5 8 Prior Queued Study Wind Gen Prior Queued Study Solar Gen W BM % C 6 offline W S offline S BM % 4 L 7 W Base Model (BM) % S Prior Queued Study Solar Gen C BM % W C BM % Southeast SD 10
STEP 2 Existing Transmission Northeast ND Light Load Transmission Constraint 100% W L offline 2 3 Load Projections BM % L W W 1 9 C Current Study Wind Gen Current Study Solar Gen W offline L 11 12 13 L S 10 L Current Study Solar Gen W S Offline C Offline L 5 8 Prior Queued Study Wind Gen Prior Queued Study Solar Gen W BM % C 6 offline W S offline S BM % 4 L 7 W Base Model (BM) % S Prior Queued Study Solar Gen C BM % W C BM % Southeast SD 11
Assuming 25% PTDF for alike generators and incremental percent for dispatch STEP 3 Northeast ND Light Load Existing Transmission 100% Transmission Constraint W 100% 2 3 BM % L W W L Load Projections 1 9 C offline L 11 12 Current Study Wind Gen Current Study Solar Gen 13 W L S 10 L W S 100% Current Study Solar Gen L offline C 5 8 BM % C 6 Prior Queued Study Wind Gen Prior Queued Study Solar Gen W offline W S offline BM % 4 L 7 S W Base Model (BM) % S BM % W Prior Queued Study Solar Gen C C BM % Southeast SD 12
INITIAL SERVICES RELIABILITY ASSESSMENT TRANSMISSION SOLUTIONS Steps Determination Perform initial facilities studies for interconnection Provides estimation of direct assigned POI and local outlet facility upgrades Test benefit against long-term EHV plan For the benefit of either CRIS or ERIS Regional component applies No benefit to either CRIS or ERIS Regional component does not apply Provides estimation of sub-regional component commitment Under multi-lane approach (decoupled) ERIS sub-regional CRIS sub-regional Identify solutions for remaining constraints 13
Planning Scenarios (Generation Resource Inclusion by Transmission Service Type) Analysis Type Steady-State ITP Assessment TPL-001 Assessment (Reliability) Same as ITP GI Assessment (Reliability) (Economic, Reliability, and Policy) 1. Base Reliability (Resources dispatched with Firm service) 2. Market Powerflow Model (Resources dispatched with Firm and Non-Firm service) 1. HVER 5 Sub-regional Groupings (Resources dispatched with Firm and Non-Firm service) 2. LVER 1 Regional Grouping (Resources dispatched with Firm and Non-Firm service) 3. NRIS 1 Regional and 5 Sub-regional Groupings (Resources dispatched with Firm and Non-Firm service) N/A Economic N/A 1. Market Economic Model 2 to 3 Futures (Resources dispatched with Firm and Non-Firm service) Varies Stability 1. MDAG (Primarily Resources dispatched with Firm service) 2. MDAG High Wind Sensitivity (Resources dispatched with Firm and Non-Firm service) Same as ITP 1. 5 Sub-regional Groupings (Resources dispatched with Firm and Non-Firm service) Short-Circuit 1. Base Reliability (Resource impacts with Firm service and Non-Firm service) 1. 5 Sub-regional Groupings (Resources dispatched with Firm and Non-Firm service) Transmission Solutions Mitigation Options Transmission and Non-Transmission Solutions Planning Scenarios (Generation Resource Inclusion by Transmission Service) in Development Transmission and Non-Transmission Solutions Electromagnetic Transient N/A N/A 1. 5 Sub-regional Groupings (Resources dispatched with Firm and Non-Firm service) Transmission and Non-Transmission Solutions Mitigation Options N/A N/A 14