Insights on Ocean Climate Change: Observations and Implications
Observations in this chapter highlight significant changes in ocean properties related to climate over the past 40 years. These changes include shifts in temperature, salinity, sea level, carbon levels, pH, and oxygen content. The patterns of change observed suggest a link between surface and subsurface ocean variations driven both by climate change and natural processes. The ocean's crucial role in storing and exchanging heat, freshwater, and carbon with the atmosphere underscores its impact on global climate change. Enhanced understanding and evidence of these changes have emerged in recent years, marking progress in oceanographic research.

Download Presentation

Please find below an Image/Link to download the presentation.
The content on the website is provided AS IS for your information and personal use only. It may not be sold, licensed, or shared on other websites without obtaining consent from the author. Download presentation by click this link. If you encounter any issues during the download, it is possible that the publisher has removed the file from their server.
E N D
Presentation Transcript
Chapter 3: Observations: Ocean Janice Bytheway ATS786 September 15, 2014
Disclaimer I m not an oceanographer. I took an Intro to Oceanography course once in undergrad, but that was a long time ago.
Synopsis The observations summarized in this chapter provide strong evidence that ocean properties of relevance to climate have changed during the past 40 years, including temperature, salinity, sea level, carbon, pH, and oxygen. The observed patterns of change in the subsurface ocean are consistent with changes in the surface ocean in response to climate change and natural variability and with known physical and biogeochemical processes in the ocean, providing high confidence in this assessment.
Importance of Ocean Ocean stores and exchanges heat, freshwater and carbon with the atmosphere. ~75% of global evaporation and precipitation occurs over oceans. Stores 50x more carbon than the atmosphere and absorbs ~30% of anthropogenic CO2 emissions. Climate change and variability on various timescales is closely linked to the ocean.
Ocean Layers Sfc 75m Upper 500m 700m 2000m 3000m Deep 6000m Bottom
Since AR4... 20+ year satellite record ~ 8 years of Argo buoy data Identification and reduction of biases in historical data More biogeochemical measurements Stronger evidence of change, and improved understanding of its causes.
3.2 Ocean Temperature and Heat Content Upper Deep Temperature changes vary with depth. Global average warming is 0.11 0.02oC/decade in upper 75m, 0.015oC per decade by 700m.
Conclusions It is virtually certain that the upper ocean (0-700m) warmed from 1971- 2010. The warming rate is 0.11 0.02oC per decade in upper 75m and 0.015 oC per decade by 700m. It is very likely that surface intensification of the warming increased the thermal stratification of the upper ocean by about 4% (0-200m) from 1971-2010. It is likely that the upper ocean warmed over the first half of the 20th century. It is likely that the waters from 700-2000m have warmed on average between 1957 and 2009 and likely that no significant trend was observed between 2000-3000m from 1992-2005. It is very likely that the deep North Atlantic Ocean (2000m and below) north of 20oN warmed from 1955-1975, then cooled from 1975-2005. It is likely that most of the water column south of the Sub-Antarctic Front warmed at a rate of ~0.03oC from 1992-2005, and waters of Antarctic origin warmed below 3000m at a global average rate approaching 0.01oC per decade at 4500m over the same time period. Sparse sampling is the largest source of uncertainty below 2000m.
3.3 Salinity and Freshwater Content Salinity refers to the weight of dissolved salts in a kilogram of seawater. Salinity of seawater can be changed only by adding or removing fresh water. This can be achieved by evaporation, precipitation, melting and freezing of ice, and ocean circulations. Changes in salinity affect the oceans ability to store heat and carbon, changes biological productivity, and contribute to regional sea level change.
Sea Surface Salinity Regional Changes 1955-2005 mean Mean E-P 1950-2000 High variability and lack of observations in Arctic Ocean, but medium confidence in freshening. Freshening of N. Pacific Salinity decrease in net precipitation regions in Bay of Bengal. Increased salinity in Arabian Sea and S. Indian Ocean. N. Atlantic salinity increases, with largest increases in Gulf Stream and Mediterranean Outflow Water. Salinity decrease in western equatorial Significant Freshening of 2008-1950 change regions and ITCZ and SPCZ. 2005-1975 change Southern Ocean
Zonally Averaged Upper Ocean Salinity (0- 500m) 1955-2010 1950-2008
Conclusions It is very likely that globally averaged contrast between regions of high and low salinity relative to the global mean salinity has increased. There is high confidence in the assessment of trends in ocean salinity. It is virtually certain that the salinity contrast between regions of high and low surface salinity has increased since the 1950s. It is very likely that since the 1950s the mean regional pattern of upper ocean salinity has been enhanced: saline waters become more saline, fresh water becomes fresher. It is very likely that the interbasin contrast between the Atlantic and Pacific has increased. It is very likely that the freshwater content in the Southern Ocean has increased. There is medium confidence that these patterns are caused by increased horizontal moisture transport in the atmosphere (changing patterns of evaporation and precipitation). It is likely that the subduction of surface water mass anomalies and the movement of density surfaces have contributed to salinity changes on depth levels.
3.4 Changes in Ocean Surface Fluxes Exchanges of heat, water, and momentum at the sea surface are important factors driving the ocean circulation. Meteorological state variables (temperature, humidity, SST, wind speed, clouds, precipitation) effect changes in air-sea fluxes. In turn, air-sea fluxes effect the atmospheric state. The accuracy of observations of air-sea fluxes is not sufficient to assess trends in heat flux.
Heat and Radiative Fluxes Latent and sensible heat fluxes are computed from state variables using parameterizations with many sources of uncertainty, while radiative fluxes are estimated from satellite measurements. LH and SH fluxes are regionally dependent and show inter-decadal variability. Shortwave radiative fluxes are latitudinally dependent The increase in mean net air-sea heat flux is small compared to the uncertainties in the global mean, and detecting a change in air-sea fluxes responsible for long-term oceanic warming is currently beyond our capability.
Precipitation and Freshwater Flux Prior to satellite era, not much available in terms of observations of ocean precipitation. Reconstructions of precipitation estimates show decadal variability, with a trend of 1.5mm month-1 century-1.
Wind stress and waves Wind stress is the shear stress wind exerts on the surface of large bodies of water. It is the force component parallel to the surface, per unit area, as applied by the wind to the water surface (Wikipedia). Most reanalyses show an increase in annual mean zonal wind stress in the Southern Ocean. Regional trends in extreme wave heights have been reported at several buoy locations since the late 1970s (some studies suggest these may be instrument-dependent artifacts) Satellite data indicates positive trends in wave height in the Southern Ocean, North Atlantic, and North Pacific.
Conclusions There is low confidence in variability of radiation averaged over the global ocean owing to the lack of direct observations There is low confidence in ocean precipitation trends. There is medium confidence that Southern Ocean wind stress has increased since the early 1980s.There is medium confidence that Tropical Pacific wind stress has increased since 1990, and low confidence in such trends in the North Atlantic. There is medium confidence that mean significant wave height has increased since the 1950s over the North Atlantic.
3.5 Changes in Water-mass Properties Temperature, salinity, concentrations of dissolved gases and nutrients Determined at the surface by air-sea interactions, and transferred to various depths by circulation. Formation and subduction of water masses are important for the ocean s capacity to store heat, freshwater, carbon, oxygen, and other climate-relevant properties.
Outflow of saline water from Mediterranean and Red Seas Freshening and cooling of NADW Freshening and warming of N. Pacific Intermediate Water =>lower density water in subtropics Warming and freshening of AAIW and AABW
Conclusions An increase in P-E and a poleward migration of density surfaces caused by warming have likely contributed to trends in the NPIW and AAIW. It is more likely than not that the export rate of AABW from the Southern Ocean declined since the 1980s. Warming of the upper ocean very likely affects the properties of water masses in the interior. From 1950-2000, it is likely that subtropical salinity maximum waters have become more saline, while fresh intermediate waters formed at higher latitudes have generally become fresher. It is very likely that in the extratropical N. Atlantic, temperature, salinity, and formation of the Upper North Atlantic Deep Water is dominated by strong decadal variability related to the NAO. It is likely that Lower N. Atlantic Deep Water has cooled from 1955-2005. It is likely that the abyssal layer ventilated by AABW warmed since the 1980s or 1990s, and that the volume of cold AABW has been reduced over this time period.
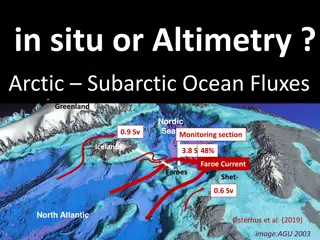
3.6 Changes in Ocean Circulation Modern observations of ocean circulation come from the Global Drifter Program, Argo buoys, and satellite altimetry, but historical observations are much more sparse. Ocean circulation studies in relation to climate have focused on variability in wind-driven gyres, changes in the meridional overturning circulations, and water exchange between ocean basins. The MOCs are responsible for much of the ocean s capacity to carry excess heat from the tropics to mid- latitudes, and are important it the ocean s ability to sequester carbon.
Conclusions There is high confidence in the expansion of the N. Pacific subtropical gyre, and there is high confidence that the southern limb of the South Pacific subtropical gyre has intensified in the last 20 years, along with the southward expansion of the East Australian Current into the Tasman Sea. These wind-driven changes are likely due to interannual to decadal variability, and longer time series of observations are needed to separate this variability from long-term trends. Coupled climate models find that a slowdown of the Atlantic Meridional Overturning Circulation is very likely in the next decades, though with uncertain magnitude. Observations of the AMOC have shown large interannual to decadal variability, no apparent trend and have a relatively short period of record. There is low confidence that there is a trend in transport of water between the Pacific and Indian Oceans through the Indonesian Throughflow. There is medium confidence that the Antarctic Circumpolar Current has shifted poleward. There is no observational evidence from the past 20 years that flow across the Greenland-Scotland Ridge, which connects the N. Atlantic with the Greenland and Norwegian Seas, has changed. Given the short duration of direct measurements of ocean circulation, we have very low confidence that multi-decadal trends can be separated from decadal variability.
3.7 Sea Level Changes, Including Extremes Sea level varies as the ocean warms or cools, water is transferred between ocean and land or ocean and ice, water is redistributed due to tides, and with changes in oceanic and atmospheric circulation. Sea level change can occur on time scales ranging from hours to centuries, spatial scales on the order of a few km to global, and can have magnitudes of a few mm to > 1m. There are a few records of sea level dating to the 1700s, with more widespread coverage by the late 1800s, and measurements on remote islands starting in the 1970s. Precise satellite altimeter measurements began with TOPEX/Poseidon in 1992.
GMSL anomalies from various observations 3.2 0.4 mm/yr (high confidence) 1.7 0.2 mm/yr While there is more disagreement on the value of a 20th century acceleration in GMSL when accounting for multi-decadal fluctuations, two out of three records still indicate a significant positive value. The trend in GMSL observed since 1993, however, is not significantly larger than the estimate of 18-year trends from previous decades. 0.6 0.2 mm/yr (~30% of total)
Regional Sea Level Changes Rates of rise in the W. Pacific warm pool are up to 3x those of the global mean, while rates over the E. Pacific are ~0 or negative. There are significant multi-decadal variations in regional sea level.
Changes in extreme sea level Extremes determined by maximum surge, annual maximum surge-at-high-water, monthly mean high water level, changes in the number of high storm surge events, or changes in 99th percentile events. Negative values caused by vertical land motion exceeding sea level rise. With median removed, only 6% of the records showed an increase of more than 5mm/yr, mostly in the southeast US and mostly linked to larger storm surge events unconnected to GMSL increases. Top: total elevation. Bottom: total elevation after annual medians removed.
Conclusions There is high confidence that the current ocean observing system is capable of resolving the rate of sea level rise and its components. It is virtually certain that globally averaged sea level has risen over the 20th century, with a very likely mean rate of 1.7 0.2 mm/yr between 1900 and 2010 and 3.2 0.4 mm/yr between 1993 and 2010. It is likely that a rate comparable to that since 1993 occurred between 1920 and 1950. Although local vertical land motion can cause even larger rates of sea level rise (or fall) relative to the coastline, it is very likely that this does not affect the estimates of the global average rate. It is virtually certain that interannual and decadal changes in the large scale winds and ocean circulation can cause significantly higher or lower rates over shorter periods at individual locations. Warming of the upper 700 m of the ocean has very likely contributed to an average of 0.6 0.2 mm/yr of sea level change since 1971. Warming between 700-2000m has likely been contributing and additional 0.1 0.1 mm/yr since 1971, with warming below 2000m likely contributing a further 0.1 0.1 mm/yr since the 1990s. It is very likely that the rate of mean sea level rise along Northern European coastlines has accelerated since the early 1800s, and that this has continued through the 20th century. It is likely that sea level rise throughout the northern hemisphere has also accelerated since 1850. It is likely that extreme sea levels have increased since 1970, largely as a result of the rise in mean sea level.
3.8 Ocean Biogeochemical Changes, Incl. Anthropogenic Ocean Acidification The reservoir of inorganic carbon in the ocean is ~50x that of the atmosphere. As such, even small changes in the ocean reservoir can have an impact on atmospheric CO2. Air-sea flux of CO2 is computed from the observed difference in the partial pressure of CO2 (pCO2) across the air-water interface, the solubility of CO2, and the gas transfer velocity. Due to measurement uncertainties, the computed CO2 flux can have uncertainties as large as 50%.
Anthropogenic carbon Best estimate of the global ocean inventory of Cant from is 155 20% PgC in 2010. This is consistent with 2.3 0.6 PgC yr-1 of uptake. Note the figures are in mol m-2(1PgC 0.23 mol m-2)
Conclusions It is virtually certain that the ocean is sequestering anthropogenic carbon dioxide and very likely that the oceanic anthropogenic carbon inventory increased from 1994-2010. Oceanic carbon uptake rates very likely range between 1.0 and 3.2 PgC/yr. There his high confidence that the pH of the ocean decreased by 0.1 since the pre-industrial era. There is medium confidence that oxygen concentrations have decreased in the open ocean thermocline in many ocean regions since the 1960s. The general decline is consistent with the expectation that warming-induced stratification leads to a decrease in the supply of oxygen to the thermocline from near-surface. It is likely that tropical oxygen minimum zones have expanded in recent decades.