Insights into Summer 2017 Climate Variations and Heatwave Events
Climate research using climate reconstructions and model simulations for summer 2017, focusing on heatwave periods and temperature anomalies. Observations from instrumented sites and atmospheric soundings were utilized to analyze air temperature, soil moisture, and radiation. The study highlights the ability of the LMDZOR model to capture heatwave intensity while noting a warm bias in simulations compared to observations. The simulations, nudged with ECMWF analysis, provide near real-time monitoring over France, aiding in understanding climate variations and extreme events.

Uploaded on Sep 12, 2024 | 0 Views
Download Presentation

Please find below an Image/Link to download the presentation.
The content on the website is provided AS IS for your information and personal use only. It may not be sold, licensed, or shared on other websites without obtaining consent from the author. Download presentation by click this link. If you encounter any issues during the download, it is possible that the publisher has removed the file from their server.
E N D
Presentation Transcript
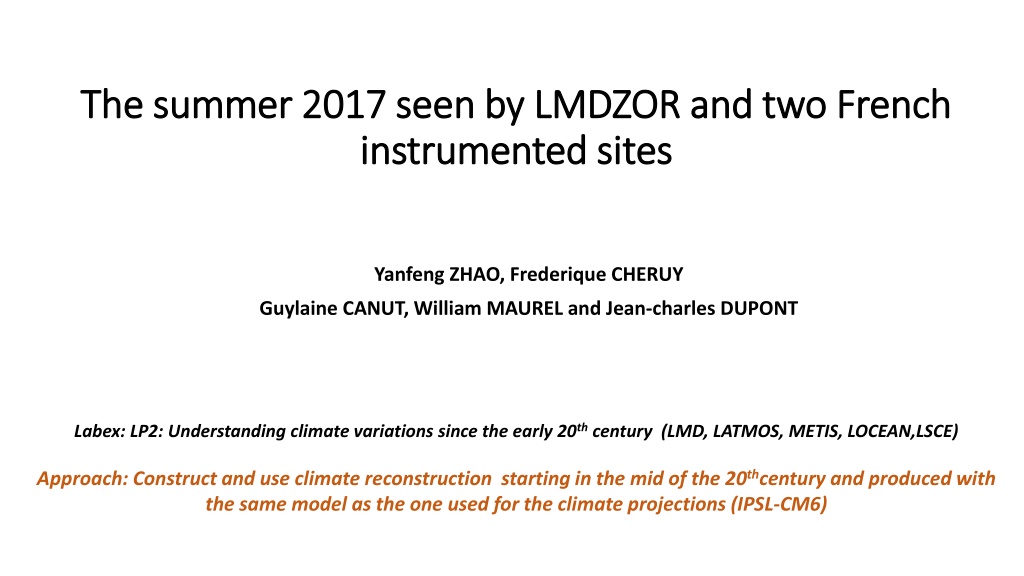
The summer 2017 seen by LMDZOR and two French The summer 2017 seen by LMDZOR and two French instrumented sites instrumented sites Yanfeng ZHAO, Frederique CHERUY Guylaine CANUT, William MAUREL and Jean-charles DUPONT Labex: LP2: Understanding climate variations since the early 20th century (LMD, LATMOS, METIS, LOCEAN,LSCE) Approach: Construct and use climate reconstruction starting in the mid of the 20thcentury and produced with the same model as the one used for the climate projections (IPSL-CM6)
Observation: a. SIRTA 1 hour mean data (surface temperature, air temperature, shortwave radiation, soil moisture content, soil temperature and relative humidity) b. Toulouse meteopole-flux data c. Atmospheric soundings from Wyoming weather web (http://weather.uwyo.edu/upperair/sounding.html) for Trappes ( 48.76N/2.00E, 2003 and 2017) and Voronez (51.65N/39.25E, 2010) Model (zoomed and nudged): a. CMIP6_V6010v3, zoomed and nudged, COSY project (June-August, 2017) b. CMIP6_V6012 ( Mega Heatwaves : 2003 and 2010) (Nudged, regular grid, L. Mellul) Heatwave: Pre_heatwave Heatwave 2003 23 July 1 August 4-13 August 2010 1-10 July 1-10 August 2017 12-17 June 18-23 June Miralles, Diego G., et al. "Mega-heatwave temperatures due to combined soil desiccation and atmospheric heat accumulation." Nature geoscience 7.5 (2014): 345.
Zoomed over France COSY : Near real time, env.50km, nudged with analysis/forecast ECMWF (wind, SST forced) SIRTA (48.7N, 2.2E) Toulouse(43.6N, 21.4E)
SIMULATIONS TEMPS REEL (dites COSY) ANALYSE ECMWF JJ-1 ANALYSE ECMWF JJ-2 PREVISION ECMWF JJ+2 JJ JJ+1 JJ+3 JJ+4 Guidage u, v JOUR J LMDZOR 1 jour Simulation LMDZOR zoom e guid e sur le site Conditions initiales sol et atmosph re Chaine mise en place sur Climserv (Polytechnique, IPSL) Rapatriement journalier automatique des analyses et pr visions (N. Poulet) Lancement automatique journalier et surveillance (N. Poulet)
Part 1: Summer representation Part 2: Heatwave period representation Summary
Air Temperature (2 m) (SIRTA and TOULOUSE) LMDZOR simulates the observed heat wave (intensity and duration) But a warm bias is present SIRTA Toulouse OBS V6010v3
Air Temperature (0-60 m) SIRTA mast DAY NIGHT Warm bias and less gradient at lower layer Night-time, too warm and not enough decoupling at surface Day-time, too much mixing at the lower layer Sample standard deviation Observation at surface, 2m, 5m, 10m, 20m and 30m AGT
Soil Moisture and Soil Temperature (SIRTA ) Lower soil moisture than the OBS at upper depths Warm bias at the upper layers, it is consistent with the warm bias at atmosphere JJA AVE 00Z Soil Moisture Soil Temperature Sechiba SIRTA Observation SIRTA Sample standard deviation
Soil Moisture and Soil Temperature (Toulouse) Lower soil moisture than the OBS around 10cm depths, and moister at other depths Warm bias above 1m depth, it is also consistent with the warm bias at atmosphere (2m) Soil Moisture Soil Temperature Sechiba Observation Sample standard deviation
Soil moisture Lower soil moisture than the observations at SIRTA for 10 cm, 30 cm and 50 cm depths At SIRTA, LMDZ and OBS time series are well correlated at 10 cm and 20 cm Soil moisture at Toulouse close to the wilting point (0.1 m3/ m3) in model 10 cm 30 cm 20 cm 50 cm
Relative Humidity (2 m) SIRTA Lower relative humidity than the observations at SIRTA for the heatwave period (daytime)
Sensible heat flux Latent heat flux SIRTA Preliminary new processing (ACTRIS) Strongly over-estimate the sensible heat flux. Under-estimated the latent heat flux in most cases.
Sensible heat flux Latent heat flux Toulouse Preliminary new processing (ACTRIS) Strongly over-estimated the sensible heat flux; Under-estimated the latent heat flux, and less evaporation for soil in model.
Short wave radiation (SIRTA) Lower albedo in model with less variability. Higher downward radiation in most cases. Albedo Downward
Short wave radiation (Toulouse) Higher albedo in model with less variability. Higher downward radiation in most cases. Albedo Downward
12Z 00Z Mega-heatwave of 2003 Model: CM6012 Pre_HW Nudging method improved the heatwave simulation very well. Cold bias for the heatwave period. HW Two representation days were selected.
12Z 00Z Mega-heatwave of 2010 Model: CM6012 Pre_HW Nudging method improved the heatwave simulation very well, especially for the atmospheric boundary layer. HW Two representation days were selected.
Air Temperature (0-60 m) SIRTA Not enough gradient at lower layer (below 10m) Warm bias for LMDZOR outputs, except the surface temperature at day-time Heatwave 2017 Summer average 00Z 12Z Observation Black: Pre_HW. Red: HW LMDZOR
Summary The model (V6010v3) can simulate the heatwave in 2017 (intensity and duration), and nudging method in the new version (V6012) improved the heatwave simulation (2003, 2010) very well. There are warm bias for summer and heatwave period. Drying of the soil moisture is well phased with observation, and stronger where the heatwave is more intensity. Model outputs yielded higher potential temperature, and haven t enough gradient for air temperature at lower layer. Model strongly over-estimated the sensible heat flux and under-estimated the latent heat flux.


")


 (SIRTA and TOULOUSE)")
 SIRTA mast")
")
")

 SIRTA")


")
")


 SIRTA")