Understanding Global Climate Change Indicators
Explore various indicators related to global climate change, including atmospheric composition, temperature, cryosphere, ocean conditions, and extreme weather events. The indicators cover a wide range of topics such as glacier mass balance, ocean acidification, heavy precipitation, droughts, and heatwaves. These indicators aim to convey the complex issue of climate change in a way that is accessible to non-experts, providing insights into the trends and patterns shaping our planet's climate.

Download Presentation

Please find below an Image/Link to download the presentation.
The content on the website is provided AS IS for your information and personal use only. It may not be sold, licensed, or shared on other websites without obtaining consent from the author. Download presentation by click this link. If you encounter any issues during the download, it is possible that the publisher has removed the file from their server.
E N D
Presentation Transcript
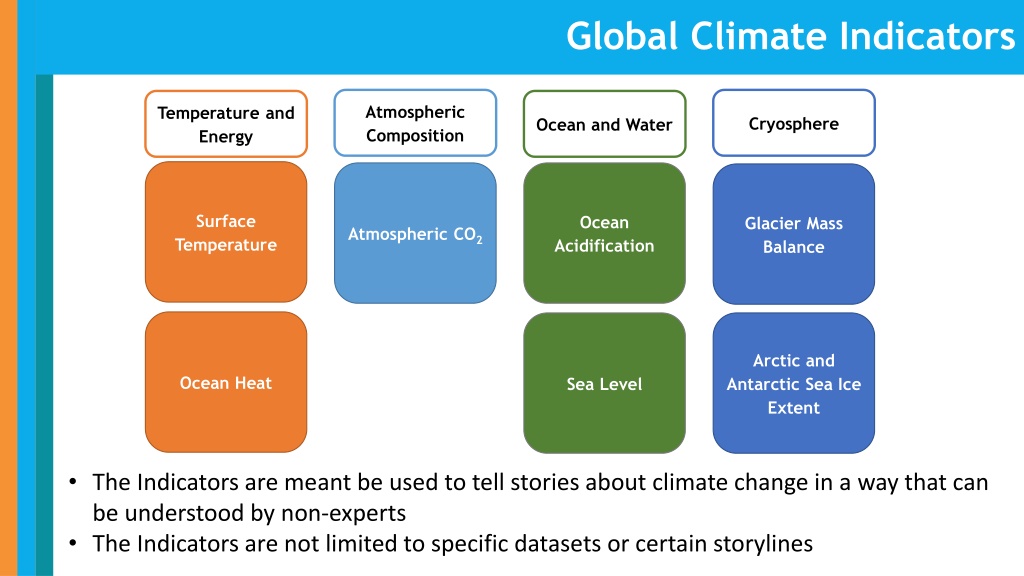
Global Climate Indicators Atmospheric Composition Temperature and Energy Cryosphere Ocean and Water Surface Temperature Ocean Acidification Glacier Mass Balance Atmospheric CO2 Arctic and Antarctic Sea Ice Extent Ocean Heat Sea Level The Indicators are meant be used to tell stories about climate change in a way that can be understood by non-experts The Indicators are not limited to specific datasets or certain storylines
Subsidiary Indicators Atmospheric Composition Temperature and Energy Cryosphere Ocean and Water Methane Top-of-Atmosphere Energy Balance Heavy Precipitation Snow Extent N2O Heat Waves Droughts Fluorinated GHG
Climate Indicators for Extremes 1.Heavy Precipitation: 95% percentile of rain (Klein-Tank et al.: Guidelines on Analysis of extremes in a changing climate in support of informed decisions for adaptation. Clim. Data Monit. 2009, 72.) 2.Droughts: GPCC Drought Index (Ziese et al.: The GPCC Drought Index a new, combined and gridded global drought index. Earth System Science Data, 2014) 3.Heatwaves: Heat Wave Magnitude Index (Russo et al.: Magnitude of extreme heat waves in present climate and their projection in a warming world. J. Geophys. Res. Atmos. 2014, 119, 12,500-12,512.)
Global Mean Trend of Heavy Precipitation (courtesy of M. Ziese, GPCC) Based on 95th percentile of daily rainfall of days 0.1mm (Standard measure for heavy precipitation e.g. for the EU)
Global Trends of Heavy Precipitation (courtesy of M. Ziese, GPCC)
Global Mean Trend of Droughts (courtesy of M. Ziese, GPCC) Based on the Standard Precipitation Index (SPI) and the Standardized Precipitation and Evaporation Index (SPEII), a decrease of the Index means an increase of droughts and vice versa.
Global heat wave trends Based on the analysis of daily maximum temperature integrating length and magnitude of heat wave. Russo et al.: Magnitude of extreme heat waves in present climate and their projection in a warming world. J. Geophys. Res. Atmos. 2014, 119, 12,500- 12,512


")
")