Local Government Audit Outcomes Analysis as of February 2013
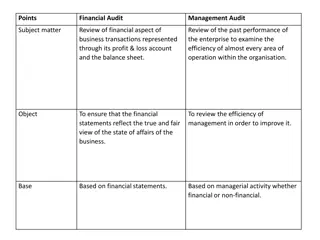
The Auditor-General of South Africa plays a crucial role in ensuring oversight, accountability, and governance in the public sector by conducting audits. This analysis reveals varying audit outcomes across provinces, highlighting the need for focused actions to improve audit results and promote clean audits. The data shows movements in clean audits and areas for improvement, emphasizing the importance of key stakeholders taking relevant steps to enhance accountability and public confidence in local government operations.

Download Presentation

Please find below an Image/Link to download the presentation.
The content on the website is provided AS IS for your information and personal use only. It may not be sold, licensed, or shared on other websites without obtaining consent from the author. Download presentation by click this link. If you encounter any issues during the download, it is possible that the publisher has removed the file from their server.
E N D
Presentation Transcript
Audit Outcomes of Local Government as at 28 February 2013
The Auditor-General of South Africa has a constitutional mandate and, as the Supreme Audit Institution (SAI) of South Africa, it exists to strengthen our country s democracy by enabling oversight, accountability and governance in the public sector through auditing, thereby building public confidence.
What is the status and progress on the audit outcomes of Local Government? What are the areas that should be focused on? CLEAN AUDIT Which key role players should take action? What vital actions should be taken?
Audit outcomes over the past three years 33 (12%) audits outstanding Net regressionover 2010-11 2% (5) 4% (9) 5% (12) 41% (101) 46% (113) 49% (119) 25% (62) 21% (52) 21% (52) 30% (73) 28% (68) 28% (68) 2011-12 2010-11 2009-10
Audit outcomes per province Limpopo 1 1 2 12 14 North West Gauteng Mpumalanga 3 2 4 6 3 4 3 6 11 9 5 Northern Cape Free State KwaZulu-Natal 1 6 9 6 7 11 7 3 9 44 10 6 Western Cape Eastern Cape 5 1 6 9 19 17 18 Adverse or disclaimer WITH findings Unqualified with NO findings Unqualified WITH findings Qualified WITH findings Audits outstanding
Movements in clean audits Regressed from clean audit to financially unqualified with findings Clean audits Regressed from clean audit to financially qualified Municipalities KwaZulu-Natal Umtshezi Local Municipality Limpopo Waterberg District Municipality Mpumalanga Ehlanzeni District Municipality Steve Tshwete Local Municipality Municipalities Municipalities Limpopo Fetakgomo Local Municipality KwaZulu-Natal eMadlangeni Local Municipality Richmond Local Municipality Umdoni Local Municipality Umzinyathi District Municipality Western Cape New: George Local Municipality New: Langeberg Local Municipality New: Mossel Bay Local Municipality Swartland Local Municipality West Coast District Municipality Mpumalanga Gert Sibande District Municipality Municipal entities Eastern Cape Joe Gqabi Economic Development Agency Municipal entities Free State Fezile Dabi District Municipality Trust Gauteng New: Johannesburg Fresh Produce Market Johannesburg Social Housing Company KwaZulu-Natal New: Durban Marine Theme Park New: ICC, Durban Safe City Pietermaritzburg (New auditee) uThungulu Financing Partnership (New auditee) uThungulu House Development Trust (New auditee) Gauteng Joburg Theatre (SOC)
Movements of the 245 auditees reported on Unqualified with no findings Unqualified with findings Qualified with findings Adverse/ disclaimer Movements 3 11 18 Improved 32 6 85 29 50 170 Unchanged 5 15 23 43 Regressed Total auditees reported on 9 101 62 73 Outstanding audits prior year opinion and 8 outstanding from prior year 33 1 2 3 19
Status of compliance with laws and regulations the auditees all There are material findings at almost 4% 6% 96% 94% 2011-12 2010-11 Auditees with no compliance findings Auditees with compliance findings
Findings on compliance with laws and regulations These areas must receive attention: 125 (51%) 12% Preparation of annual financial statements and annual report 128 (52%) 135 (55%) 136 (56%) Establishment, operation and effectiveness of audit committees 9% 20% Management of assets and investments Approval and control of expenditure and payment within 30 days 14% 6% 185 (76%) 188 (77%) Management of procurement and contacts Prevention and follow-up of unauthorised, irregular and/or fruitless and wasteful expenditure 12% 216 (88%) 15% Quality of the financial statements submitted for auditing
Quality of annual performance reports 79% There are material findings on the performance reports of of the auditees 20% 21% 79% 80% 2011-12 2010-11 Auditees with no PDO findings Auditees with PDO findings
Findings on the quality of performance reports Non- or late submission 10% Usefulness of the information 68% No No change 2011-12: 24 2010-11: 35 2011-12: 167 2010-11: 184 change Reliability of the information 51% No change 2011-12: 124 2010-11: 129
What are the areas that should be focused on?
Focus areas to improve audit outcomes The status of all 6 areas is unchanged. Supply chain management Quality of Human resource management performance reports 21% 24% 47% 53% 76% 79% Information technology (IT) controls Quality of submitted financial statements Financial health (going concern) 12% 2% 17% 83% 88% 98% With no findings With findings
Quality of submitted financial statements Due to correction of material misstatements during the audit process, of auditees were able to avoid qualifications. 33% Outcome if NOT corrected Outcome after corrections 29 (12%) 135 (55%) 110 (45%) 216 (88%) Unqualified Qualified
Findings on information technology (IT) controls No improvement in IT and management intervention is required 53% of auditees have challenges with control design in all four areas 4% 20% 2% 22% IT governance the foundation for effective IT Security management 78% 74% 20%3% 3% 22% IT service continuity User access management 75% 77% IT controls embedded and functioning effectively IT controls to be implemented IT controls to be designed
Using consultants effectively to improve financial reporting 76% of municipalities used consultants to generate and prepare financial statements at a total cost of approximately R352 million. Unqualified with findings (101) Unqualified with no findings (9) 33% (3) 70% (71) used consultants Recurring use at 58 auditees Recurring use at 3 auditees used consultants No skills transfer at 31 auditees Qualified with findings (62) Adverse/ disclaimers (72) 84% (52) used consultants 85% (61) used consultants Recurring use at 39 auditees Recurring use at 47 auditees No skills transfer at 31 auditees No skills transfer at 52 auditees Reasons for use of consultants Lack of necessary technical skills (159) Preparation of AFS and FAR (2) Vacancies (13) Other reasons (13)
What vital actions should be taken?
Improving the drivers of key controls will improve audit outcomes Slight improvement in Governance Regression in Leadership and Financial and performance management Leadership Financial and performance management Governance 19% 23% 25% 29% 28% 30% 33% 32% 35% 35% 33% 37% 48% 45% XX% 37% 40% 37% 34% 2011-12 2010-11 2011-12 2010-11 2011-12 2010-11 Good Causing concern Intervention required
as will addressing the continuing pervasive root causes Key positions vacant or key officials lacking appropriate competencies Lack of consequences for poor performance and transgressions Slow response by political leadership in addressing the root causes of poor audit outcomes
Which key role players should take action?
Extensive assurance should be provided by the key role players First level of assurance Management/ leadership Second level of assurance Internal independent assurance and oversight Third level of assurance External independent assurance and oversight Senior management Internal audit Municipal council Municipal public accounts committee Audit committee Municipal manager Treasury, Cooperative governance department, Premier s office Legislature and portfolio committee Mayor External audit


 controls")