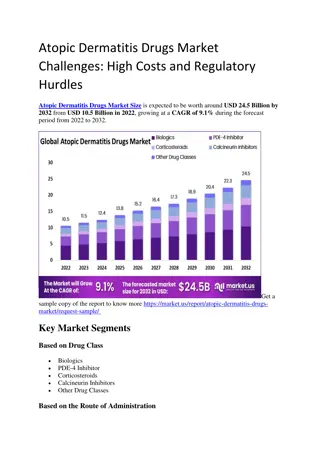
Analysis of Atopic Eczema in Children: A National Clinical Audit Program

The British Association of Dermatologists conducted a national clinical audit program in 2015 to evaluate atopic eczema in children based on NICE guidelines. The audit included contributions from BAD and BSPD members, as well as private providers. It involved 128 submissions from 98 centers, with 1264 patients assessed. The audit examined the age distribution, disease severity, and treatment regimens for mild, moderate, and severe cases of atopic eczema. Emollients were commonly used across all severity levels, with varying combinations of topical steroids, calcineurin inhibitors, bandages, and systemic therapies. The audit highlighted the importance of tailored treatment strategies based on disease severity.

Download Presentation

Please find below an Image/Link to download the presentation.
The content on the website is provided AS IS for your information and personal use only. It may not be sold, licensed, or shared on other websites without obtaining consent from the author. Download presentation by click this link. If you encounter any issues during the download, it is possible that the publisher has removed the file from their server.
E N D
Presentation Transcript
British Association of Dermatologists National Clinical Audit Programme 2015: Atopic eczema in children (NICE CG57)
BAD-BSPD-NICE national audit on atopic eczema in children Audit contributors BAD and BSPD members, with some contributions from non-members and private providers Leads Drs Ali Al-Sharqi, David de Berker, M. Firouz Mohd Mustapa Audit standards source NICE clinical guidelines for the management of atopic eczema in children (CG57) Completion date March 2015 Number of contributors 128 submissions from 98 identifiable centres (including 6 private providers) Number of patients 1264 Regional breakdown of participants 15 18 17 17 14 n=128 12 10 % 8 7 7 6 5 5 5 4 4 4 0 Northern Ireland & Eire East Midlands North London Wales Scotland North West North East Yorkshire & The Humber West Midlands South London East of England South West South East Coast Thames Valley & Wessex
Age distribution and breakdown of disease severity Prevalence of mild, moderate and severe disease Age distribution of patients 528 40 428 28.76% 26.74% 30 % n=1244 20 150 n=1137 106 10 32 20 0 No response 0 to <6 months old 1 to <5 years old 5 to <13 years old 6 months to <1 year old 13 to 17 years old 44.50% Mild Moderate Severe
Breakdown of treatment regimen by disease severity Treatment regimen for mild disease (as determined at the last visit) 1.22% 1.22% 0.61% 8.26% 15.9% n=327 24.16% 48.62% Emollients Emollients with mild potency topical steroids Emollients with moderate potency topical steroids Emollients with topical calcineurin inhibitors Emollients with bandages Emollients with systemic therapy Emollients with potent topical steroids Treatment regimen for moderate disease (as determined at the last visit) Treatment regimen for severe disease (as determined at the last visit) 6.13% 1.32% 0.33% 1.98% 7.71% 0.79% 1.78% 28.95% 29.93% 12.65% 0.33% n=506 n=304 9.21% 23.03% 1.97% 68.97% 4.93% Emollients Emollients with mild potency topical steroids Emollients with mild potency topical steroids Emollients with moderate potency topical steroids Emollients with moderate potency topical steroids Emollients with topical calcineurin inhibitors Emollients with topical calcineurin inhibitors Emollients with bandages Emollients with bandages Emollients with phototherapy Emollients with phototherapy Emollients with systemic therapy Emollients with systemic therapy Unknown Emollients with potent topical steroids Emollients with potent topical steroids
Disease severity of patients receiving emollients with bandages, systemic and phototherapy Disease severity of patients receiving emollients with bandages 7.14% 32.14% n=28 60.71% Mild Moderate Severe Disease severity of patients receiving emollients with phototherapy Disease severity of patients receiving emollients with systemic therapy 1.71% 8.55% 15.09% n=19 n=84 84.91% 89.74% Moderate Severe Mild Moderate Severe
Audit standard: Provision of evidence-based information Provision of evidence-based information to patients and/or carers 16.38% 28.24% n=1264 55.38% No Yes Yes (info partially meets requirements) Provision of evidence-based information to patients and/or carers Provision of evidence-based information to patients and/or carers 100 100 80 80 60 60 % 40 40 20 20 0 0 34/46 72/169 28/50 89/170 85/134 19/40 28/59 44/70 42/70 24/40 60/120 15/38 99/180 61/78 42/46 145/169 41/50 119/170 119/134 38/40 55/59 48/70 63/70 28/40 93/120 37/38 155/180 74/78 Northern Ireland & Eire Northern Ireland & Eire East Midlands North London Wales East Midlands North London Wales Scotland Scotland North West North West North East Yorkshire & The Humber North East Yorkshire & The Humber West Midlands West Midlands South London South London East of England East of England South West South West South East Coast South East Coast Thames Valley & Wessex Thames Valley & Wessex n=700 n=1057 Boxplots representing the distributional mean percentage of Yes responses (n=700) and Yes with Partial Yes responses (n=1057) to having provided evidence- based information to each patient and/or carer, per hospital in each region.
Audit standard: Assessment of disease severity Assessment of disease severity at each visit 0.16% 7.67% 27.53% n=1264 64.64% No response No Yes Yes (but not each time) Assessment of disease severity at each visit Assessment of disease severity at each visit 100 100 80 80 60 % 60 % 40 40 20 20 0 0 19/46 121/169 28/50 100/170 105/134 16/40 39/59 54/70 46/70 22/40 73/120 27/38 118/180 49/78 40/46 163/169 44/50 155/170 126/134 39/40 57/59 67/70 70/70 36/40 106/120 35/38 162/180 65/78 Northern Ireland & Eire Northern Ireland & Eire East Midlands North London Wales East Midlands North London Wales Scotland Scotland North West North West North East Yorkshire & The Humber North East Yorkshire & The Humber West Midlands West Midlands South London South London East of England East of England South West South West South East Coast South East Coast Thames Valley & Wessex Thames Valley & Wessex n=817 n=1165 Boxplots representing the distributional mean percentage of Yes responses (n=817) and Yes with Partial Yes responses (n=1165) to having recorded assessment of disease severity for each patient at any visit, per hospital in each region.
Audit standard: Assessment of impact on quality of life Assessment of impact on quality of life at each visit 29.19% 41.38% n=1264 29.43% No Yes Yes (but not each time) Assessment of impact on quality of life at each visit Assessment of impact on quality of life at each visit 100 100 80 80 60 % 60 % 40 40 20 20 0 0 17/46 39/169 15/50 32/170 48/134 4/40 19/59 27/70 31/70 24/40 42/120 8/38 38/180 28/78 42/46 100/169 41/50 96/170 101/134 37/40 43/59 51/70 65/70 37/40 84/120 31/38 111/180 56/78 Northern Ireland & Eire Northern Ireland & Eire East Midlands North London Wales Scotland North West North East Yorkshire & The Humber East Midlands North London Wales Scotland North West North East Yorkshire & The Humber West Midlands South London East of England South West West Midlands South London East of England South West South East Coast South East Coast Thames Valley & Wessex Thames Valley & Wessex n=895 n=372 Boxplots representing the distributional mean percentage of Yes responses (n=372) and Yes with Partial Yes responses (n=895) to having recorded assessment of impact on quality of life for each patient at any visit, per hospital in each region.
Audit standard: Assessment of impact on psychosocial well-being Assessment of impact on psychosocial well-being at each visit 0.08% 37.58% 38.29% n=1264 24.05% No response No Yes Yes (but not each time) Assessment of impact on psychosocial well-being at each visit Assessment of impact on psychosocial well-being at each visit 100 100 80 80 60 % 60 % 40 40 20 20 0 0 19/46 31/169 16/50 20/170 41/134 1/40 10/59 23/70 24/70 25/40 38/120 4/38 30/180 22/78 44/46 84/169 41/50 80/170 88/134 22/40 41/59 48/70 44/70 37/40 79/120 22/38 101/180 57/78 Northern Ireland & Eire Northern Ireland & Eire East Midlands North London Wales East Midlands North London Wales Scotland Scotland North West North West North East Yorkshire & The Humber North East Yorkshire & The Humber West Midlands West Midlands South London South London East of England East of England South West South West South East Coast South East Coast Thames Valley & Wessex Thames Valley & Wessex n=304 n=788 Boxplots representing the distributional mean percentage of Yes responses (n=304) and Yes with Partial Yes responses (n=788) to having recorded assessment of impact on psychosocial well-being for each patient at any visit, per hospital in each region.
Audit standard: Assessment of trigger factors at initial consultation Assessment of trigger factors at initial assessment 0.40% 29.67% n=1264 69.94% No response No Yes Assessment of trigger factors at initial assessment 100 80 60 % 40 20 0 29/46 123/169 46/50 120/170 91/134 27/40 47/59 53/70 58/70 31/40 93/120 28/38 81/180 57/78 Northern Ireland & Eire East Midlands North London Wales Scotland North West North East Yorkshire & The Humber West Midlands South London East of England South West South East Coast Thames Valley & Wessex n=884 Boxplots representing the distributional mean percentage of Yes responses to having recorded assessment of trigger factors for each patient at initial consultation, per hospital in each region.
Audit standard: Management approach according to stepped-care plan Management approach according to the stepped-care plan 0.08% 7.12% n=1264 92.80% No response No Yes Management approach according to the stepped-care plan 100 80 60 % 40 20 45/46 151/169 50/50 142/170 131/134 34/40 53/59 67/70 69/70 38/40 109/120 38/38 171/180 75/78 Northern Ireland & Eire East Midlands North London Wales Scotland North East North West Yorkshire & The Humber West Midlands South London East of England South West South East Coast Thames Valley & Wessex n=1173 Boxplots representing the distributional mean percentage of Yes responses to having recorded a management approach according to the stepped-care plan, per hospital in each region.
Audit standard: Prescription of leave-on emollients (250-500 g weekly) Prescription of leave-on emollients in quantities of 250-500 g weekly 0.08% 47.15% n=1264 52.77% No response No Yes Prescription of leave-on emollients in quantities of 250-500 g weekly 100 80 60 % 40 20 0 10/46 89/169 50/50 105/170 95/134 21/40 14/59 39/70 30/70 7/40 47/120 18/38 89/180 53/78 Northern Ireland & Eire East Midlands North London Wales Scotland North East North West Yorkshire & The Humber West Midlands South London East of England South West South East Coast Thames Valley & Wessex n=667 Boxplots representing the distributional mean percentage of Yes responses to having recorded prescription of leave-on emollients in quantities of 250-500 g per week for each patient, per hospital in each region.
Audit standard: Moderate steroids on face and neck >5 days Moderate steroids on face and neck >5 days (between last two visits) 0.24% 8.07% 12.34% n=1264 79.35% No response N/A No Yes Moderate steroids on face & neck >5 days between last two visits 100 80 60 % 40 20 0 44/46 134/169 34/50 105/170 106/134 38/40 55/59 61/70 65/70 32/40 84/120 35/38 158/180 52/78 Northern Ireland & Eire East Midlands North London Wales Scotland North East North West Yorkshire & The Humber West Midlands South London East of England South West South East Coast Thames Valley & Wessex n=1003 Boxplots representing the distributional mean percentage of No responses to having recorded the use of moderate potency topical corticosteroids on the face and neck for more than 5 days between the last two visits for each patient, per hospital in each region.
Audit standard: Moderate/potent steroids on vulnerable areas >7-14 days Moderate/potent steroids on vulnerable areas >7-14 days (between last two visits) 3.24% 0.40% 13.45% n=1264 82.91% No response N/A No Yes Moderate/potent steroids on vulnerable areas >7-14 days between last two visits 100 80 60 % 40 20 0 46/46 136/169 38/50 112/170 113/134 40/40 56/59 63/70 66/70 30/40 91/120 29/38 157/180 71/78 Northern Ireland & Eire East Midlands North London Wales Scotland North East North West Yorkshire & The Humber West Midlands South London East of England South West South East Coast Thames Valley & Wessex n=1048 Boxplots representing the distributional mean percentage of No responses to having recorded the use of moderate or potent topical corticosteroids on vulnerable areas for more than 14 days between the last two visits for each patient, per hospital in each region.
Audit standard: Very potent steroids in the absence of specialist care Very potent steroids in the absence of specialist care 0.40% 3.64% 4.83% n=1264 91.14% No response N/A No Yes Very potent steroids in the absence of specialist care 100 80 60 % 40 20 0 46/46 153/169 42/50 157/170116/134 29/40 55/59 70/70 65/70 38/40 106/120 38/38 166/180 71/78 Northern Ireland & Eire East Midlands North London Wales Scotland North West North East Yorkshire & The Humber West Midlands South London East of England South West South East Coast Thames Valley & Wessex n=1152 Boxplots representing the distributional mean percentage of No responses to having recorded the use of very potent topical corticosteroids in the absence of specialist care for each patient, per hospital in each region.
Audit standard: Appropriate referral Appropriate referral 0.71% 6.88% n=1264 92.41% No response No Yes Appropriate referral 100 80 60 % 40 20 43/46 162/169 50/50 146/170 129/134 32/40 52/59 67/70 58/70 40/40 109/120 38/38 170/180 72/78 Northern Ireland & Eire South London North London East of England Yorkshire & The Humber West Midlands East Midlands Scotland South East Coast South West Thames Valley & Wessex Wales North West North East n=1168 Boxplots representing the distributional mean percentage of Yes responses to having recorded an appropriate referral for each patient, per hospital in each region.
Audit standard: Late referral Late referral 0.79% 15.35% n=1264 83.86% No response No Yes Late referral 100 80 60 % 40 20 0 40/46 148/169 46/50 141/170 120/134 30/40 51/59 63/70 52/70 31/40 94/120 35/38 138/180 71/78 Northern Ireland & Eire East Midlands North London Wales Scotland North West North East Yorkshire & The Humber West Midlands South London East of England South West South East Coast Thames Valley & Wessex n=1060 Boxplots representing the distributional mean percentage of No responses to having recorded a late referral for each patient, per hospital in each region.
Audit standard: Availability of a range of unperfumed emollients Availability of a range of unperfumed emollients on prescription 3.03% n=98 96.97% No Yes