Renewable Energy Potential Assessment in Odisha by iFOREST
Odisha holds significant renewable energy potential, with assessed capacities in solar, biomass, and wind energy. The Odisha Renewable Energy Policy aims to decarbonize the energy sector by leveraging state renewable energy potential, leading to a reduction in CO2 emissions, job creation, and minimal land requirements.
Download Presentation

Please find below an Image/Link to download the presentation.
The content on the website is provided AS IS for your information and personal use only. It may not be sold, licensed, or shared on other websites without obtaining consent from the author. Download presentation by click this link. If you encounter any issues during the download, it is possible that the publisher has removed the file from their server.
E N D
Presentation Transcript
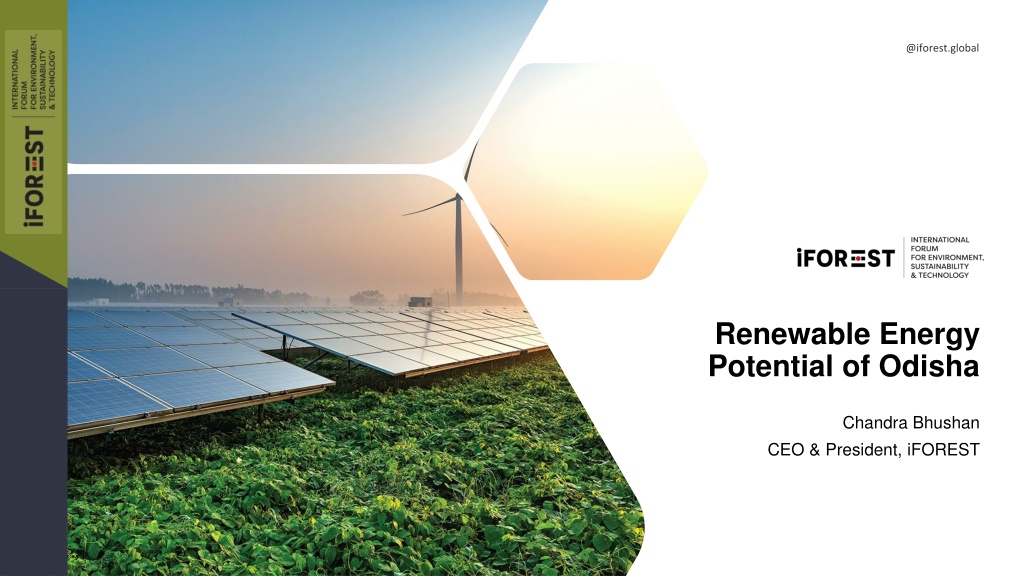
Renewable Energy Potential of Odisha Chandra Bhushan CEO & President, iFOREST
RE potential Re RE potential Re- -assessment assessment MNRE (MW) iFOREST (MW) MNRE vs. iFOREST assessed RE potential of Odisha Solar 25,780 156,000 Biomass 246 3,400 Wind 8346 (120m) 86 high-potential site identified with an average CUF of 22%-29% at 150 m hub height across 16 districts. Need detailed ground- level assessment 28-09-2024 @iforest.global 2
Impacts of OREP, 2022 Impacts of OREP, 2022 RE capacity requirement for meeting new RPO of 43.33% by 2029-30 The OREP, 2022 aims to decarbonize the energy sector by harnessing the state s RE potential Source Wind Hydro Other Total Utility 900 300 4,500 5,700 Captive 2,600 900 12,500 16,000 Total 3,500 1,200 17,000 21,700 28-09-2024 @iforest.global 3
CO2 emission reduction of 32% and PM, NOx & SOx emission reduction of 29% from utility consumption. Minimal utility tariff increase of 2-3% relative to baseline trend. Creation of 478,890 solar jobs and 4,445 wind jobs for meeting utility and captive requirements. Minimal land requirement - 1.8% of the total wasteland area or 8.3% of the total reservoir area needed for setting up 17 GW solar capacity to meet the Other RPO Impact of implementing the OREP, 2022 by 2029-30 Projected utility tariff trend due to increased RE procurement aligned with new RPO 28-09-2024 @iforest.global 4
