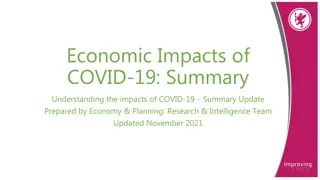
Economic Impact of Pandemic Relief Programs in Maryland May 2021
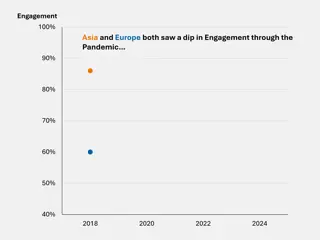
Evolution of estimates for ongoing general fund revenues in Maryland, detailing the impact of pandemic relief programs and federal fiscal policies on the state's economic outlook. The data shows changes in revenue estimates for fiscal years 2020, 2021, and 2022, reflecting the response to the COVID-19 pandemic through various relief bills and monetary policies.

Download Presentation

Please find below an Image/Link to download the presentation.
The content on the website is provided AS IS for your information and personal use only. It may not be sold, licensed, or shared on other websites without obtaining consent from the author. Download presentation by click this link. If you encounter any issues during the download, it is possible that the publisher has removed the file from their server.
E N D
Presentation Transcript
ECONOMIC IMPACT OF PANDEMIC RELIEF PROGRAMS IN MARYLAND PANDEMIC SPENDING WORKGROUP MAY2021 Andrew Schaufele Chief Bureau of Revenue Estimates
Evolution of Estimates for Ongoing General Fund Revenues (Key State Revenues Not Included: Casinos, Motor Fuel, Vehicle Titling, others) Dollars in Millions Last Pre-Covid Estimate1 Fiscal Year 2020 Fiscal Year 2021 Fiscal Year 2022 March 2020 18,763 19,367 19,998 Fiscal Year 20204 Fiscal Year 2021 Fiscal Year 2022 $ Change From March 2020 % Change From March 2020 $ Change From March 2020 % Change From March 2020 $ Change From March 2020 % Change From March 2020 Date of Estimate2 (925) -4.9% (2,061) -10.6% (2,563) -12.8% May 2020 Baseline3 (1,125) -6.0% (2,629) -13.6% (3,951) -19.8% May 2020 Pessimistic3 (144) -0.8% (673) -3.5% (523) -2.6% September 2020 Baseline (144) -0.8% (1,390) -7.2% (1,424) -7.1% September 2020 Pessimistic NA NA (609) -3.1% (312) -1.6% December 2020 NA NA (185) -1.0% 161 0.8% March 2021 Source: Comptroller of Maryland, Bureau of Revenue Estimates Notes: 1 This row includes that actual general fund dollars estimated in March 2020, as the emergence of COVID was unfolding 2 The table below includes the change for that fiscal year's estimate relative to the Pre-Covid estimate 3 This was an unofficial forecast, it was meant to put a ballpark estimate for the potential impact 4 Fiscal Year 2020 finished off the official estimate by just $144 million
Monetary Policy Federal Reserve Interest Rate Target Significant and pre-emptive reduction in rate target Quantitative Easing Larger than any single round during Great Recession Forward Guidance Keep rate target low Inflation target is an average over time, not a ceiling Promise to make up for past misses Lending programs
Major Covid-19 Relief Bills Federal Fiscal Policy Consolidated Appropriations Act of 2021 (CAA): Passed 12/27/2020 $900 billion in economic stimulus $600 stimulus checks Extending UI benefits & eligibility Second round of PPP funding American Rescue Plan Act of 2021 (ARPA): Passed 03/11/2021 $1.9 trillion in economic relief $1,400 stimulus checks Extends expanded UI through September Extends previous relief programs Additional economic support for states Expanded Child & Dependent related tax credits Coronavirus Preparedness and Response Supplemental Appropriations Act (CPARSA): Passed 03/06/2020 $8.3 billion in for Covid-19 response and vaccine research. $3 billion for Covid-19 Vaccine R&D Families First Coronavirus Response Act (FFCR) : Passed 03/18/2020 $104 billion in direct spending Expanded sick leave Free Covid-19 testing Economic support for states Coronavirus Aid, Relief, and Economic Security Act (CARES): Passed 03/27/2020 $2.2 trillion in economic stimulus $1,200 stimulus checks Expanded UI benefits & eligibility PPP funding
Economic Impact Payments (Stimulus Checks) - Significant Simulation of ARPA Economic Impact Payments Income_Amount Less than or equal 0 Count Count - EIPs Sum - EIPs Average 17,912 17,167 38,271,800 2,229 Between 1 and 25,000 771,547 616,787 1,338,334,200 2,170 Between 25,001 and 50,000 610,714 604,885 1,477,950,600 2,443 Between 50,001 and 75,000 406,565 405,932 1,016,439,200 2,504 Between 75,001 and 100,000 279,246 185,237 622,937,140 3,363 Between 100,001 and 150,000 340,849 230,884 923,315,470 3,999 Between 150,001 and 200,000 167,584 33,296 71,369,564 2,143 Between 200,001 and 250,000 85,011 - - Between 250,001 and 300,000 44,242 - - Between 300,001 and 500,000 55,449 - - Between 500,001 and 1,000,000 22,241 - - Greater than 1,000,000 9,720 - - Total Total 2,811,080 2,811,080 2,094,188 2,094,188 5,488,617,974 5,488,617,974 2,621 2,621
Labor Impact Still Significant 5.4% fewer workers than Pre-Covid
Final Thoughts Recent Events Are Encouraging, But Long Way to Go FREE LUNCH? What is the cost for our stimulus??? Short-Term Inflation versus Long-Term Inflation Higher Interest Rates slower future economic growth What happens to the broader financial economy with delayed and perhaps delinquent mortgage and rent payments? Local budgets to be more impacted due to heavier reliance on property tax? (Commercial property to undergo valuation correction) Accelerated shifts to AI and robotics?
Thank You Andrew Schaufele Comptroller of Maryland Chief, Bureau of Revenue Estimates aschaufele@marylandtaxes.gov


 - Significant")