Overview of Federal Coronavirus Relief Funds for Postsecondary Education in Kentucky
The Interim Joint Committee on Appropriations & Revenue discussed the distribution and utilization of Federal Coronavirus Relief Funds for postsecondary education in Kentucky. Funds were allocated for financial aid grants to students, institutional support, and various educational initiatives. The presentation highlighted the specific allocations to public postsecondary institutions like the Higher Education Emergency Relief Fund and Governor's Emergency Education Relief Fund. Details on fund utilization, grants, and initiatives under different relief acts were provided.

Download Presentation

Please find below an Image/Link to download the presentation.
The content on the website is provided AS IS for your information and personal use only. It may not be sold, licensed, or shared on other websites without obtaining consent from the author. Download presentation by click this link. If you encounter any issues during the download, it is possible that the publisher has removed the file from their server.
E N D
Presentation Transcript
Interim Joint Committee on Appropriations & Revenue Budget Review Subcommittee on Education June 2, 2021 Aaron Thompson, CPE President Bill Payne, Vice President of Finance and Administration Shaun McKiernan, Director of Finance and Budget
Overview Federal Coronavirus Relief Funds Asset Preservation Performance Funding Postsecondary Education Working Group Performance Distribution (Fiscal 2021-22) 2
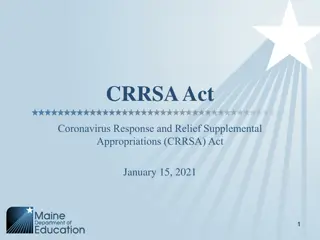
Federal Coronavirus Relief Funds Timeline of Major Legislation Coronavirus Response and Relief Supplemental Appropriations Act CRRSAA Coronavirus Aid, Relief, and Economic Security Act CARES Act Mar 27, 2020 Nov 12, 2020 Mar 11, 2021 Dec 27, 2020 CRF ARP Act Coronavirus Relief Funds (OSBD allocation) American Rescue Plan Act 4
Federal Coronavirus Relief Funds Awards to Students and Institutions (All Sources) The three major federal relief acts include: Financial Aid Grants to Students Institutional Portion Federal Coronavirus Relief Funds For Public Postsecondary Institutions $200 $186.9 Millions Total Relief Funds $751.5 Million $177.1 $180 Two primary funds for higher education: Higher Education Emergency Relief Fund (HEERF) Governor s Emergency Education Relief (GEER) Fund $166.1 $160 $140 $295.9 39% Students: Grant aid to students (required portion) Institutions: PPE and COVID-19 testing Campus modifications, facilities support Mental health support Lost revenue due to reduced enrollment Tuition and fee waivers Refunds for room and board, parking Move to online instruction $120 $455.6 61% $100 $80 $72.4 $54.5 $54.5 $60 $40.0 $40 $20 $0.0 $0 CARES CRF CRRSAA ARP 5 Student Grants Institutional Portion
Federal Coronavirus Relief Funds Governor s Emergency Education Relief Fund GEER I (CARES Act): Kentucky received $43.8 M, of which $13.8 M was designated by the Governor for postsecondary institutions (administered by CPE) GEER I can be used to support: Remote learning PPE and COVID-19 testing Campus modifications, facilities support Mental health support Scholarships and tuition Public Universities KCTCS Institutions Mental Health Private Institutions Total $8.8 M 2.5 M 1.5 M 1.0 M $13.8 M GEER II (CRSSAA): $4.0 M for institutions (of $19.3 M Kentucky total) $3.0 M used to fund grants to support Summer Bridge Programs at postsecondary institutions $1.0 M for other initiatives (College and Career Academies) 6
Federal Coronavirus Relief Funds Coronavirus Relief Funds (CRF) Governor allocated $40 M of CRF to the public postsecondary institutions Replaced $20 M of campus General Fund with $20 M of federal CRF in 2020-21 Institutions also received another $20 M of CRF in 2020-21 without a GF reduction General Fund appropriations were restored in the enacted 2021-22 budget (HB 192) CRF by Institution $14 Millions Total CRF $40.0 Million $12 $10 $6.1 $8 $4.0 $6 CRF can be used to support: Eligible payroll expenses Medical and protective supplies Distance learning Telework capabilities Refunds to students (tuition, room & board, etc.) $2.9 $4 $6.1 $1.7 $1.5 $2 $4.0 $1.2 $1.0 $2.9 $0.9 $0.6 $1.7 $1.5 $1.2 $1.0 $0.9 $0.6 $- UK UofL EKU KSU MoSU MuSU NKU WKU KCTCS General Fund Swap Additional Federal Funds 7
Federal Coronavirus Relief Funds Related Costs and Forgone Revenue Kentucky Public Postsecondary Institution Comparison of Federal Coronavirus Relief Funds and COVID-19 Related Costs and Foregone Revenue Fiscal Years 2019-20 and 2020-21 May 12, 2021 A B C D Federal Coronavirus Relief Funds Eligible Costs and Foregone Revenue A + B CARES, GEER I and CRRSAA Coronavirus Relief Funds American Rescue Plan COVID-19 Related Costs Forgone Revenue Eligible Costs & Forgone Revenue Federal Award Residual (Deficit) Ineligible Costs & Forgone Revenue Institution Total Awards UK UofL EKU KSU MoSU MuSU NKU WKU KCTCS $28,812,020 22,130,185 20,784,004 13,370,918 12,715,280 11,120,664 14,614,810 21,130,653 93,906,748 $12,260,000 5,873,000 3,023,800 1,173,400 1,771,800 2,022,400 2,415,000 3,390,800 8,069,800 $23,524,613 18,714,729 15,556,086 1,909,895 9,762,043 8,850,253 11,400,319 16,177,572 71,193,940 $64,596,633 46,717,914 39,363,890 16,454,213 24,249,123 21,993,317 28,430,129 40,699,025 173,170,488 ($51,870,387) (18,355,827) (6,453,857) (7,776,975) (8,518,892) (8,900,214) (10,145,923) (11,248,059) (61,845,143) ($70,070,007) (58,395,700) (12,130,849) (4,071,835) (16,488,669) (7,313,788) (18,838,563) (10,253,381) (58,090,748) ($121,940,394) (76,751,527) (18,584,706) (11,848,810) (25,007,561) (16,214,002) (28,984,486) (21,501,440) (119,935,891) ($57,343,761) (30,033,613) 20,779,184 4,605,403 (758,438) 5,779,315 (554,357) 19,197,585 53,234,597 ($17,703,000) (5,084,500) (2,128,981) (586,700) (1,807,900) (2,033,694) (3,071,500) (1,695,400) (5,148,600) Total $238,585,282 $40,000,000 $177,089,450 $455,674,732 ($185,115,277) ($255,653,540) ($440,768,817) $14,905,915 ($39,260,275) Sector Research Comps KCTCS $50,942,205 93,736,329 93,906,748 $18,133,000 13,797,200 8,069,800 $42,239,342 63,656,168 71,193,940 $111,314,547 171,189,697 173,170,488 ($70,226,214) (53,043,920) (61,845,143) ($128,465,707) (69,097,085) (58,090,748) ($198,691,921) (122,141,005) (119,935,891) ($87,377,374) 49,048,692 53,234,597 ($22,787,500) (11,324,175) (5,148,600) 8
Asset Preservation Projected Need versus State Investment Vanderweil Facilities Advisors: Initial VFA Study was completed in 2007, updated in 2013 Projected Asset Preservation Need versus State Investment Fiscal Years 2007 through 2022 VFA Study Projections: State Investment: Identified investment needed to bring campus E&G facilities up to industry standards Projected Asset Appropriations for Preservation Need1 Time Period Biennium Asset Preservation 2007-2011 2012-2016 2017-2021 $5.1 billion 6.3 billion $7.3 billion 2008-10 2010-12 2012-14 2014-16 2016-18 2018-20 2020-22 $22.0 million 0.0 0.0 240.0 million 0.0 0.0 $19.0 million $281.0 million Over the past seven biennia, the state spent $281.0 million on facilities renovation and renewal 1 Cumulative Need This represents about 3.8% of the projected $7.3 billion system total asset preservation need 10
Asset Preservation Spending on New Construction versus Renovation Over the past 24 years, Kentucky has invested: $1.7 billion in new and expanded E&G facilities $514.0 million in state funded asset preservation projects The ratio of spending on new construction to asset preservation was 3-to-1 11
Asset Preservation 2020-22 Capital Request Funding Source 2020-21 2021-22 Biennium $200 100 $300 $200 100 $300 $400 200 $600 State Bond Funds Campus Match Total (Dollars in Millions) Request Features: $400 M of bond funds matched with $200 M of campus funds ($.50 on the $1.00) State plus campus funds would address about 8% of projected $7.3 B total need CPE recommended a funding pool, allocated based on each institution s share of system total asset preservation need; supported by a list of priority projects No requests for new construction or information technology projects 12
Asset Preservation 2020-22 Capital Request (Cont d) Rationale for Request: Total asset preservation need projected to reach $7.3 B by 2021 There has been minimal state investment in asset preservation since 2008 (i.e., $281 M or 3.8% of projected need) Investment is needed to maintain the value, functionality, safety and security of state-owned facilities Modern facilities and systems reduce operating costs and better serve students Construction costs continue to increase with each passing year 13
Postsecondary Education Working Group Role and Responsibilities KRS 164.092, Section 11(b)(c) Beginning in fiscal year 2020-21 and every three fiscal years thereafter, the postsecondary education working group shall convene to: determine if the funding model is functioning as expected identify any unintended consequences of the model recommend any adjustments to the model The results of the review and recommendations of the working group shall be reported to the Governor, the Interim Joint Committee on Appropriations and Revenue, and Interim Joint Committee on Education 15
Postsecondary Education Working Group Models Functioning as Expected State funding is no longer distributed based on historical share, but on student success outcomes produced Models are providing financial incentives for student progression and timely completion, and premiums for STEM+H, URM, and LI degrees Institutions have reacted to the models strategically: Increased alignment between campus and state goals Adopted internal budget allocation models to reward performance Expanded emphasis on need-based aid and completion grants Universities and KCTCS institutions have progressed toward funding parity (equilibrium achieved at 5 of 8 universities, 10 of 16 KCTCS colleges) 16
Postsecondary Education Working Group Models Functioning as Expected (Cont d) High-Wage High-Demand, URM, and Targeted Industry credentials grew at rates well above total credentials Despite a premium in the model, credentials awarded to low-income students grew less than other credentials Percent Change in Bachelor's Degrees Produced by Type Between Academic Years 2013-14 and 2019-20 Total Bachelor's Degrees 12.0% Percent Change in KCTCS Credentials Produced by Type Between Academic Years 2015-16 and 2019-20 STEM+H Bachelor's Degrees 30.4% Total Credentials 27.7% STEM+H Credentials 29.0% URM Bachelor's Degrees 40.0% URM Credentials 40.1% Low-Income Credentials 16.9% Low Income Bachelor's 1.0% Underprepared Credentials 45.1% -10% 0% 10% 20% 30% 40% 50% Source: Council on Postsecondary Education, Data and Advanced Analytics Unit, Performance Funding Database. High-Wage High-Demand 79.8% STEM+H and URM degrees grew by more than double and triple the rate of total bachelor s degrees, respectively Despite a premium in the model, bachelor s degrees awarded to low income students rose by about 1% Targeted Industry Sectors 40.3% 0% 15% 30% 45% 60% 75% 90% Source: Council on Postsecondary Education, Data and Advanced Analytics Unit, Performance Funding Database. 17
Postsecondary Education Working Group Models Functioning as Expected (Cont d) Kentucky on track to achieve 60x30 attainment goal: Undergraduate degrees and credentials need to grow by 1.7% per year to reach goal Kentucky Public and Private Postsecondary Institution Undergraduate Degrees and Credentials1Surpassing Growth Rate Needed Academic Years 2015-16 Through 2019-20 3.3% 3.5% 2.8% Over the past four years, the annual number of degrees and credentials awarded grew by about 3.5% per year 4.3% 0.3% Average Annual Growth Rate of 1.7% Needed to Meet 60x30 Goal Performance funding and other CPE initiatives have encouraged degree production despite recent enrollment declines 2015-16 2016-17 2017-18 2018-19 2019-20 Trendline to Reach 60x30 Goal Percent Change from Prior Year Source: Kentucky Postsecondary Education Data System (KPEDS). 1Unduplicated Completers. 18
Postsecondary Education Working Group Unintended Consequences For four years, models were applied with no new funding Funding Models for the Universities and KCTCS Institutions Implementation Schedule and Funding Sources (Dollars in Millions) Lack of state support resulted in redistribution of the General Fund base among institutions Institution Contribution New Total Funding1 Timeline Fiscal Year Funding Year 0 Year 1 Year 2 Year 3 2017-18 2018-19 2019-20 2020-21 $42.9 31.0 38.7 $14.9 $0.0 0.0 0.0 $0.0 $42.9 31.0 38.7 $14.9 Hold harmless and stop loss provisions were scheduled to end in 2021-22 (KRS 164.092) Year 4 2021-22 $0.0 $17.3 $17.3 KSU, MoSU, MuSU, and six KCTCS colleges were facing fiscal cliffs in 2021-22 1Represents state appropriations, stop-loss contributions, and other campus carve outs added to the Performance Fund, which were then distributed among institutions based on outcomes produced. 19
Postsecondary Education Working Group Recommended Adjustments Establish a General Fund Floor equal to each institution s 2020-21 regular appropriation, plus any performance distribution, minus debt service and mandated programs Policymakers should prioritize maintaining the General Fund Floor over providing new funds to the Performance Fund Going forward, there should be no redistribution of base funding among postsecondary institutions All funding in the Performance Fund will come from appropriations provided by the General Assembly, rather than campus stop loss contributions (i.e., 0% stop loss) 20
Postsecondary Education Working Group Recommended Adjustments (Cont d) CPE and KCTCS will use existing funding models with no changes to distribute any new funds appropriated to the Performance Fund Performance distributions will be nonrecurring to institutions that earn those funds, so that appropriated funds will be recurring to the Performance Fund in subsequent years CPE will reconvene the working group and submit recommended revisions to the models by no later than December 1, 2023 21
Postsecondary Education Working Group Current Status In response to working group recommendations, SB 135 was introduced to effect changes in the performance funding statute SB 135 passed the House and Senate with no changes and was signed into law by the Governor on March 18 The bill amended the Performance Funding Statute (KRS 164.092) based on Work Group recommendations CPE staff ran the 2021-22 iteration of the university funding model and shared the resulting preliminary distribution with campus CBOs Campus CBOs and IR Directors validated performance data and model calculations and the distribution was finalized on April 9 22
Performance Distribution (Fiscal 2021-22) University and KCTCS Models The enacted budget (HB 192) appropriated $17.3 M to the Performance Fund Fiscal 2021-22 Performance Distribution Institution That amount was allocated between the universities and KCTCS based on sector share of total adjusted net General Fund (per KRS 164.092) UK UofL EKU KSU MoSU MuSU NKU WKU $6,086,400 2,972,500 120,200 0 0 0 $13.5 M was distributed among universities based on share of student success outcomes produced and operational activity 2,902,700 1,398,800 The remaining $3.8 M was distributed among KCTCS institutions using their model (detail available upon request) University Sector $13,480,600 KCTCS 3,826,500 Total Performance Fund $17,307,100 23
Performance Distribution (Fiscal 2021-22) Impact of Exceeding Sector Average Performance Funding Model for the Public Universities Table 7 - Change in Funding Model Metric Three-Year Rolling Averages (Weighted Activity Volume) Between 2020-21 and 2021-22 Iterations April 19, 2021 Student Success Component Bachelor's Degrees (Normalized) Pool Size = $47.7 M in 2021-22 2020-21 Iteration 2021-22 Iteration Volume Change Percent Change 2020-21 Share 2021-22 Share Status Institution UK UofL EKU KSU MoSU MuSU NKU WKU 8,191 5,167 2,706 237 1,214 1,733 2,161 2,910 8,568 5,208 2,758 131 1,119 1,722 2,153 3,048 377 41 52 (107) (95) (11) (8) 138 4.6% 0.8% 1.9% -45.0% -7.9% -0.6% -0.4% 4.7% Above Below Above Below Below Below Below Above UK UofL EKU KSU MoSU MuSU NKU WKU 33.7% 21.2% 11.1% 1.0% 5.0% 7.1% 8.9% 12.0% 34.7% 21.1% 11.2% 0.5% 4.5% 7.0% 8.7% 12.3% Sector 24,320 24,706 386 1.6% = Average 100.0% 100.0% STEM+H Bachelor's Degrees Pool Size = $26.5 M in 2021-22 2020-21 Iteration 2021-22 Iteration Volume Change Percent Change 2020-21 Share 2021-22 Share Status Institution UK UofL EKU KSU MoSU MuSU NKU WKU 2,950 1,566 871 3,068 1,638 864 118 72 (7) (15) (7) (31) 25 34 4.0% 4.6% -0.8% -29.9% -1.9% -4.4% 3.5% 4.0% Above Above Below Below Below Below Above Above UK UofL EKU KSU MoSU MuSU NKU WKU 36.5% 19.4% 10.8% 0.6% 4.6% 8.9% 8.6% 10.6% 37.1% 19.8% 10.4% 0.4% 4.4% 8.3% 8.7% 10.8% 51 375 720 698 857 36 368 688 723 892 24 Sector 8,089 8,277 188 2.3% = Average 100.0% 100.0%
Performance Distribution (Fiscal 2021-22) Metric Scorecard Performance Funding Model for the Public Universities Table 8 - Metrics Where Rates of Growth Exceeded Sector Average Between Fiscal years 2020-21 and 2021-22 April 19, 2021 Performance Metric Student Success Outcomes Bachelor's Degrees STEM+H Bachelor's Degrees URM Bachelor's Degrees Low Income Bachelor's Degrees Student Progression @ 30 Hours Student Progression @ 60 Hours Student Progression @ 90 Hours Earned Credit Hours Operational Support Activity Instructional Square Feet Direct Cost of Instruction FTE Students UK UofL EKU KSU MoSU MuSU NKU WKU Metrics Above Sector Average 10 7 3 3 2 1 6 5 25
Questions? Twitter: CPENews and CPEPres Facebook: KYCPE Website: http://cpe.ky.gov


")
")
")