Analysis of College Data Trends for Strategic Planning
This report by Dr. Mary Schaal delves into key data trends for strategic planning in a college setting. It covers aspects such as student enrollment, attendance, ethnicity, age demographics, and course success by delivery mode. The data visualizations provide insights into patterns and changes over the years, aiding in informed decision-making for the institution's future.
Download Presentation

Please find below an Image/Link to download the presentation.
The content on the website is provided AS IS for your information and personal use only. It may not be sold, licensed, or shared on other websites without obtaining consent from the author. Download presentation by click this link. If you encounter any issues during the download, it is possible that the publisher has removed the file from their server.
E N D
Presentation Transcript
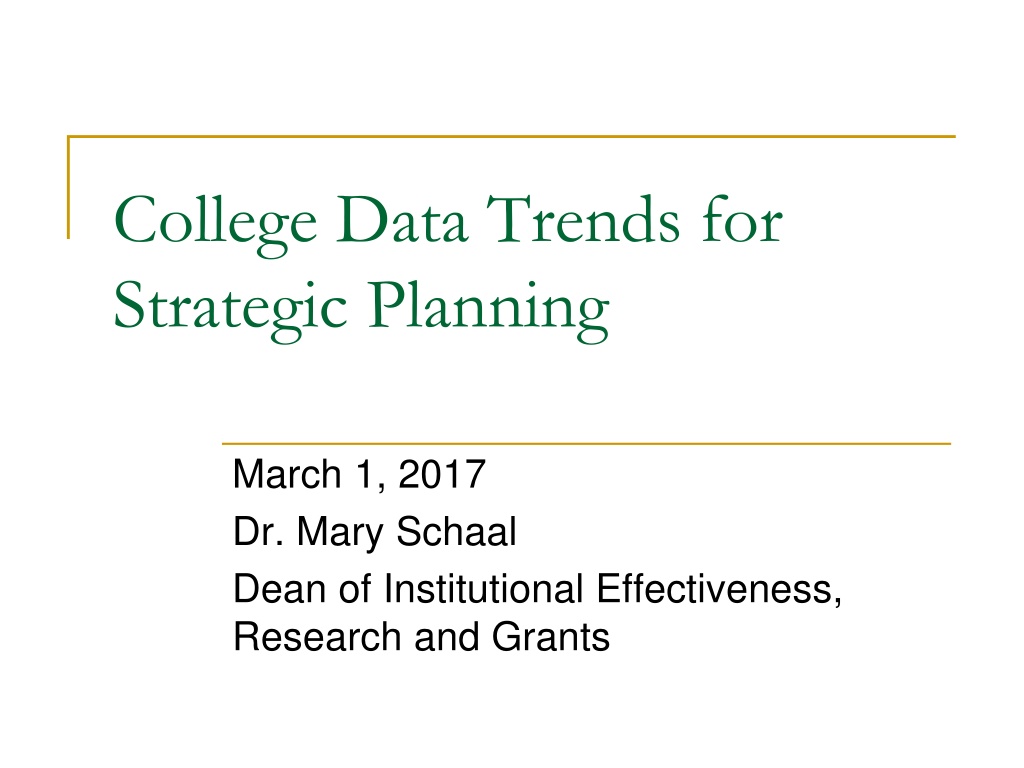
College Data Trends for Strategic Planning March 1, 2017 Dr. Mary Schaal Dean of Institutional Effectiveness, Research and Grants
Annualized Full-Time Student Equivalent and Unduplicated Student Headcount 6,000 14,000 12,000 5,000 10,000 4,000 8,000 3,000 6,000 2,000 4,000 1,000 2,000 0 0 06/07 07/08* 08/09 09/10 10/11 11/12 12/13 13/14 14/15 15/16 4,279 4,577 4,769 5,304 5,828 5,636 5,537 5,451 5,433 5,312 FTSE Headcount 11,309 12,051 11,858 12,585 13,344 12,813 11,941 11,817 12,127 11,766 Source: AWC Enrollment Services (FTSE) and Institutional Eff., Research & Grants (Unduplicated Headcount) *Includes Summer 2007 and 2008 as well as fall and spring 2007-2008
Trend of Enrollment by Attendance 100 80 60 40 20 0 06- 07 07- 08 08- 09 09- 10 10- 11 11- 12 12- 13 13- 14 14- 15* 15- 16* 27 73 24 76 34 66 31 69 31 69 31 69 33 67 30 70 20 80 19 81 Full-time Part-time Source: AWC Institutional Effectiveness, Research & Grants *New Method: Enrolled in 24+ credits on census dates throughout academic year Old Method (used 05-06 through 13-14): Counted as full-time if registered 12+ credits on census date in fall or spring
Trend of Enrollment by Ethnicity 100 50 0 06- 07 07- 08 08- 09 09- 10 10- 11 11- 12 12- 13 13- 14 14- 15 15- 16 10 9 35 46 11 9 33 47 10 9 31 50 11 8 29 52 10 8 29 53 10 8 26 56 10 7 24 59 12 3 22 63 12 3 22 63 12 3 20 65 All Other International Caucasian Latino Source: AWC Institutional Effectiveness, Research & Grants
Trend of Student Age 35 30 25 20 15 10 5 0 06/07 07/08 08/09 09/10 10/11 11/12 12/13 13/14 14/15 15/16 31 24 30 24 30 24 29 23 29 23 27 23 27 22 27 23 27 23 27 23 Average Median Source: AWC Institutional Effectiveness, Research & Grants
Trend of Course Success by Delivery Mode 100% 95% 93% 94% 95% 94% Face to Face Hybrid Online 82% 80% 80% 80% 78% 50% Online, 67% Online, 73% Online, 69% Online, 71% Online, 72% 0% 11/12 12/13 13/14 14/15 15/16 Source: AWC Institutional Effectiveness, Research and Grants
Largest Disciplines, FY2015 Discipline Student Cr. Hrs. Avg. Size Math 24,958 16.7 English 23,247 17.5 Psychology 8,564 19.0 English as a Second Language 7,445 17.5 Biology 6,428 22.5 Administration of Justice 5,550 13.9 Computer Information Systems Physical Education/Recreation Orientation 3,891 3,460 3,284 14.7 15.3 27.3 Nursing 3,146 15.0 Sociology 3,066 18.3
High Performing Programs (5 years) Top 10 Certs Awarded Certificate AGEC-A Foundations/Construction 1,156 Nursing Assistant AGEC-S EMT Basic Basic Plumbing Masonry AGEC-B Preschool Education Automotive Brakes & Suspension Top 10 Degrees Degree General Studies (AA) Associate in Arts Admin. of Justice Nursing (AAS) Business (ABUS) Psychology/Sociology Business, Gen. (AAS) Family Studies General Studies (AGS) Radiologic Technology N 2,195 Yrs. N Yrs. 841 354 285 240 232 170 90 87 82 76 6.3 6.0 5.2 8.7 5.8 5.3 8.6 5.8 7.3 7.5 5.8 1.0 4.7 5.2 3.0 1.3 1.3 5.8 6.7 548 286 255 224 207 205 86 78 3.7 AWC offers 91 degree and 63 certificate programs
Fully Online Programs 4 Accredited Programs ONLINE Only Few Completers TRANSFER Students Only Administration of Justice 2, 4.9 yrs. to complete Business 5, 3.4 yrs. to complete Education 0 Media Arts 0
Trend of Credentials Awarded 2500 Credentials Awarded 2000 1500 1000 500 0 06/07 505 492 997 07/08 08/09 09/10 10/11 970 656 11/12 992 652 12/13 1,078 625 1,703 13/14 1,215 819 2,034 14/15 1,441 921 2,362 15/16 1,468 Certificates Degrees Total 638 540 1,178 736 567 707 552 962 2,430 Source: AWC Institutional Effectiveness, Research and Grants 1,303 1,259 1,626 1,644
Educational Attainment 18-24 & 25+ 40,000 35,000 30,000 25,000 20,000 15,000 10,000 5,000 - **25+ Some Coll, No AA 30,695 3,498 *18-24 <HS Grad **18-24 Some Coll-AA *25+ <9th Grade *25+ 9- 12, No Diploma **18-24 HS Grad 18-24 BA+ **25+ HS Grad 25+ MA+ 25+ AA 25+ BA Yuma La Paz 4,844 345 7,634 530 10,699 436 657 - 18,297 1,500 17,894 2,230 31,385 5,675 9,122 1,063 11,746 996 6,271 546
Educational Attainment 18+, AWC Service Potential Estimate 73,700 Service Potential College ready adults 18+ not yet attending AWC 25,313 Adults 18+ with gr 9-12 education but no diploma, potentially needing GED prep & services 19,797 Adults 25+ with < 9th grade education, potentially needing adult literacy 30,401 Adults with AA degrees or higher, potentially in need of lifelong learning services excluding winter visitors and all others listed above
Population Growth and Projected Trends 1990 to 2030 500,000 Service Area Populaiton 400,000 291,663 300,000 195,760 272,885 179,741 238,939 200,000 236,174 100,000 120,739 0 1990 2000 2010 2015 2020 2025 2030 = actual (U.S. Census) = projection (AZ Dept. of Administration)
Trend of Ethnicity Yuma County 2015-2050 100 80 60 40 20 0 2015 2020 2025 2030 2035 2040 2045 2050 6 5 5 5 5 6 5 5 All Other Caucasian Latino 32 62 30 65 28 67 26 69 24 71 22 72 21 74 20 75 Source: AZ Dept. of Administration, Office of Employment & Population Statistics, 12/11/15
Trend of Ethnicity La Paz County 2015-2050 100 80 60 40 20 0 2015 2020 2025 2030 2035 2040 2045 2050 4 4 5 5 5 5 5 5 All Other Asian Caucasian Latino 11 59 26 12 56 28 12 52 31 12 49 34 13 45 37 13 42 40 13 39 43 13 37 45 Source: AZ Dept. of Administration, Office of Employment & Population Statistics, 12/11/15
