Immune Cell Analysis Supplementary Figures
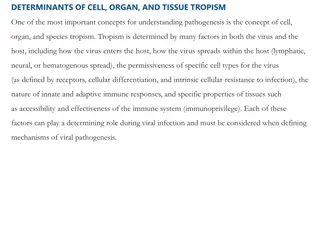
This collection of supplementary figures provides detailed flow cytometry data on immune cell populations, including CD4+ T cells, CD8+ T cells, tumor-associated macrophages, and more. The figures also include information on immune checkpoint molecules like PD-L1 and TIGIT. Each figure presents specific gating strategies, marker expression profiles, and cellular interactions in the tumor microenvironment.

Download Presentation

Please find below an Image/Link to download the presentation.
The content on the website is provided AS IS for your information and personal use only. It may not be sold, licensed, or shared on other websites without obtaining consent from the author. Download presentation by click this link. If you encounter any issues during the download, it is possible that the publisher has removed the file from their server.
E N D
Presentation Transcript
Supplementary Figure 1 SSC-A SSC-A SSC-A FSC-A Viability Dye CD45-APC SSC-H FSC-H Gated on CD4+ T cells CD25-PE-Vio770 CD4-VioGrenn CD3-A700 Foxp3-Vio515 CD8-BV605 CD45-APC Gated on CD8+ T cells TIGIT PE-Dazzle 594 CD8-APC
Supplementary Figure 2 PD-L1+ PD-L1-PE Gated on CD45- FSC-A SSC-A SSC-H FSC-H Gated on CD45+ FSC-A SSC-A SSC-A SSC-A CD45-APC SSC-H FSC-H Viability Dye Gated on CD11b+ Gated on TAMs F4/80 PerCP-vio700 MHC-II A488 SSC-A CD206-PE-Dazzle 594 CD11b-VioGrenn CD11b-VioGrenn Gated on F4/80- Ly6G-BV785 Ly6C-VioBlue
Supplementary Figure 3 FSC-A SSC-A SSC-A SSC-A Viability Dye CD45-APC SSC-H FSC-H Gated on CD8+ Gated on CD3+ CD8-BV605 CD3-A700 GrzB-PE CD45-APC CD45-APC CD45-APC
Supplementary Figure 4 B 16F 10 1600 1400 Ig G IgG + 3x8 G y T um or volum e (m m3) A nti-T IG IT + an ti-P D -L 1 1200 A n ti-T IG IT + anti-P D -L 1 + 3x8 G y 1000 800 600 400 200 0 0 10 20 D ays from beginning of R T