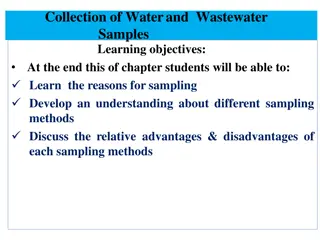
Field Guide to Data-Rich Life: Sampling in Evaluation

Welcome to the webinar series hosted by Durham's Partnership for Children on living a data-rich life. This session focuses on the use of sampling in evaluation, discussing initial steps, types of samples, and its importance. Learn about designing evaluations, identifying outcomes, and specific measures for outcomes using logic models and tools. Get insights on addressing community needs and system development. Join us to enhance your data quality knowledge!

Download Presentation

Please find below an Image/Link to download the presentation.
The content on the website is provided AS IS for your information and personal use only. It may not be sold, licensed, or shared on other websites without obtaining consent from the author. Download presentation by click this link. If you encounter any issues during the download, it is possible that the publisher has removed the file from their server.
E N D
Presentation Transcript
Field Guide to Living a Data-Rich Life Webinar 8: Using Sampling in your Evaluation Hosted by Durham s Partnership for Children, with support from the North Carolina Partnership for Children Presented by Compass Evaluation and Research
Field Guide to Living a Data-Rich Life Welcome Compass Evaluation and Research Webinar 8 in our year long data quality series Last time (webinar 7), we discussed Use of standard assessments for collecting data Pros and Cons of standards assessments Importance of training Today, we will: Discuss initial steps for designing an evaluation Identify types of samples Discuss the use of sampling in your evaluation Sampling
Field Guide to Living a Data-Rich Life Recap: Start with the End in Mind Compass Evaluation and Research Think about what data you will need at the end of your program To what extent has the program addressed big picture needs in the community? Issues such as student achievement, poverty, child welfare To what extent has the program addressed little picture needs in systems development and service delivery? Issues such as access to high quality, evidence-based programs or the affordability of care Helpful tools: Logic Model Theory of Change Sampling
Field Guide to Living a Data-Rich Life Recap: Start with the End in Mind Compass Evaluation and Research Use a logic model to identify outcomes Examples: improve affordability of high quality child care or enhance child development Identify specific measures for outcomes Improved affordability change over time in the number and percent of lower income children in higher quality care Enhance development change over time in the number and percent of children whose development is on or ahead of expectations Identify specific tools for specific measures Improved affordability subsidy enrollment figures Enhanced development child assessment instrument such as the Ages and Stages Questionnaire or the Brigance (there are many child assessment tools) Sampling
Field Guide to Living a Data-Rich Life Designing an Evaluation Compass Evaluation and Research Step 1: Logic Model and Theory of Change Identify your outcomes Step 2: Develop evaluation questions Turn outcomes into questions Identify outcome measures Step 3: For each question: Identify variables from the outcome measures Identify data collection approaches and tools Webinars 5-7 Sketch out an analysis framework Step 4: Collect data Sampling
Sample Logic Model: Supporting Young Families Program Field Guide to Living a Data-Rich Life Target Population Need Without support and resources, young adults often fail to complete their education, creating a risk for economic stability Young families within one year of completing High School or in first year of college Compass Evaluation and Research Short-Term Outcomes Longer-Term Outcomes Outputs Inputs Strategies & Activities # of clients served with home visits; total # of home visits Home visitation services Clients will exhibit family resilience Clients will improve parenting skills # of clients attending group workshops; total # of group workshops Administrative and bookkeeping support Group workshops # of clients receiving advocacy services; total # and type of advocacy services provided Advocacy services Advisory Council Clients will complete their one-year educational goals Clients will complete a college degree # of clients receiving referrals; total # and type of referrals provided Facilitated referrals # of clients receiving education support; total # and type of education support services provided Education support Logic Models and the Theory of Change
Field Guide to Living a Data-Rich Life Designing an Evaluation Compass Evaluation and Research Step 2: Develop evaluation questions Outcome 1: To what extent have parents improved their parenting skills? Outcome measure: Number and percent of parents who exhibit gains in parenting skills, using a standardized measure of parenting capacity. Sampling
Field Guide to Living a Data-Rich Life Designing an Evaluation Step 3: Identify variables, data collection approaches and tools, and analytic framework Compass Evaluation and Research Tie your variables to your needs statements and outcomes then choose the tool or tools that best capture those variables. Variables: Family time, work-life balance, coping strategies Approach: interviews, standard assessment Tools: Interview protocol, Parent Coping Scale (PCS) Analysis: content analysis of interview responses; identification of change scores on the PCS; if possible, gains within treatment statistical analysis of change scores Sampling
Field Guide to Living a Data-Rich Life Designing an Evaluation Compass Evaluation and Research Step 4: Collect your data Option 1: collect data from everyone Option 2: collect data from a sample of clients or participants Interview Parent Coping Scale ?? ?? Option 1: Everyone Option 2: Sample ?? ?? Sampling
Field Guide to Living a Data-Rich Life How and when to sample Identifying the type of sample that is right for you Probability sample: Census or universe Simple random Stratified random Cluster Multi-stage Non-Probability sample: Convenience/opportunistic Snowball Self-selecting Compass Evaluation and Research Probability sample: we can calculate the chances of each member being included in the sample this allows us to discuss whether or not data from the sample are representative of the larger population Sampling
Field Guide to Living a Data-Rich Life Pros and Cons of Sampling Approaches Compass Evaluation and Research Pros Cons Probability Sample Can determine how representative the data are important when making statistical analyses and statements Expense researcher must adhere to the sampling frame Non-Probability Sample Expense can be more cost efficient than probability samples Have to account for lack of randomization in your analyses and reporting Sampling
Field Guide to Living a Data-Rich Life Probability Sampling Approach Compass Evaluation and Research Census/Universe sample everyone in your client or participant pool 100% chance of each member being included in data collection Simple random names in the hat approach Each member has an equal chance of being included in the sample Stratified random develop groups of interest first (i.e., strata), and then randomly sample within each stratum Within each strata, there is an equal chance of being included Use of strata for organizing data, affects overall chances of being included Sampling
Field Guide to Living a Data-Rich Life Probability Sampling Approach Compass Evaluation and Research Cluster assign members into clusters and sample the clusters Collect data on members from the sampled clusters Differs from a stratified sample Stratified sample: each strata contributes members Example: Geography (North, South, East, and West) each contributes members to the study Clusters: only the sampled clusters contribute members Example: 10 rich and 10 poor schools are sampled from a larger pool of 100 rich and 100 poor schools; students in the sampled clusters contribute data Multi-stage combination of sampling strategies Example: cluster sampling of schools followed by random sampling of students within schools Sampling
Field Guide to Living a Data-Rich Life Non-Probability Sampling Approach Compass Evaluation and Research Convenience or opportunistic who is available to provide data? Snowball use sampled members to generate the names of additional members Self-selection members volunteer their data Note the opportunity for bias in data collection using a non- probability sampling approach Sampling
How Big Does My Sample Need To Be? Field Guide to Living a Data-Rich Life Depends upon (estimates of) the size of your population How many individuals are being represented by your sample? Depends upon how variable your data are Data will a lot of variability (answers all over the place) larger sample Data with a little variability (answers are more alike than not) smaller sample Depends on how confident in the findings you want to be The + or (margin of error) of reporting survey data Confidence interval metric Typical to want to be at least 90% (or more) confident that your findings reflect the truth Confidence level metric Compass Evaluation and Research Sampling
Field Guide to Living a Data-Rich Life Take Home Messages on Sample Size Better not to guess about sample size Especially if using data in statistical analyses Multiple sample size calculators available online Also OK to ask for help Compass Evaluation and Research Sample size still may be larger than what you were anticipating Sampling
Field Guide to Living a Data-Rich Life Back to our example Population to be estimated is 200 individuals 200 individuals were served in the program Can afford to complete the PCS with all members Can not afford to complete interviews with all members Will develop a simple random sample of members to participate in interviews Population to be described is 200 Assume high variability in the data Confidence interval of +/- 3 points Confidence level of 95% Sample size = 169 Compass Evaluation and Research Sampling
Field Guide to Living a Data-Rich Life Compare to Population to be described is 200 Assume high variability in the data Confidence interval of +/- 5 5 points Confidence level of 93% Sample size = 132 132 Compass Evaluation and Research Sampling
Field Guide to Living a Data-Rich Life Back to our example Compass Evaluation and Research Interview Parent Coping Scale Option 1: Everyone X 200 clients served in program Option 2: Sample 132 members (+/- 5 point margin of error) X Sampling
But sampling can get way more complicated Adding strata Do you want to ensure representation from racial/ethnic groups? Locations? Types of families? Program staff? Adding clusters Can program participants be assigned to clusters? What is the basis for clustering? Cohorts? Program staff? Topics or curriculum used (if there is variation here) Will you be combining sampling approaches? Field Guide to Living a Data-Rich Life Compass Evaluation and Research Sampling
Field Guide to Living a Data-Rich Life Working with Sampled Data Compass Evaluation and Research Sampled data must be treated differently than non- sampled data A census or universe sample is non-sampled data Everyone has 100% chance of being included in the sample Account for probability of being included in the sample May also have to account for non-response Being included in the sample does not mean an individual will give you the data or information that you need Sampling
Questions? Field Guide to Living a Data-Rich Life Compass Evaluation and Research Sampling
Next Steps The webinar series is designed to help you create a plan to capture, manage, analyze, and use high quality data: August 30, 2016: Best Practices in Data Collection and Management. September 28, 2016: Finding the Value in Evaluation: Cultural Relativity and Bias. October 25, 2016: Using Data: Effective Reporting and Grant Writing. November 30, 2016: Thinking Beyond Your Program: Evaluating Systems and Collaborations. Field Guide to Living a Data-Rich Life Compass Evaluation and Research Sampling
Additional questions? Taylor Webber-Fields Durham s Partnership for Children Phone: 919-403-6960 (extension 231) Email: taylor@dpfc.net Field Guide to Living a Data-Rich Life Compass Evaluation and Research Sampling
Additional questions? Feel free to contact me, too! Sarah Heinemeier Compass Evaluation and Research Phone: 919-308-5019 Email: sarahhei@compasseval.com Field Guide to Living a Data-Rich Life Compass Evaluation and Research Sampling