Exporting STATA Results to Excel Using PutExcel Feature

EXPORTING DATA TO EXCEL AND WORD
Options we will cover today
•
Putexcel
•
Dynamic Documents
•
Outreg2
What is putexcel?
PutExcel allows you to easily export STATA results to an Excel file. You can export matrices, stored
results, images, and estimation tables, as well as add your own formulas to calculate fields.
This is helpful if you a series of descriptive statistics, rates, or things like lifetables that you want to easily
transfer to Excel, without risk of errors from manual entry.
PutExcel also supports a variety of cell and number formatting options. You can add your own static text
as well for things such as labelling.
Basic syntax
To start, you first need to tell STATA what workbook (and, optionally, sheet) you want to put your results
in. If you don’t specify a sheet, Excel will use “Sheet1”
putexcel set "T:\Third Semester Classes\PRC TA Work\MaritalStatusData", sheet(summary) replace
Next, it’s best practice to label your cells so you can place your data appropriately. You can manually
write in text, or use formulas or macros to populate cells. In the below example, we are telling STATA to
label cells B2 to F2 with different text we specified.
putexcel B2 = "Marriages" C2 = "Cohabitations" D2 = "Sample" E2 = "Marriage Rate" F2 = "Cohabitation
Rate"
Matrices
You can create matrices from a variety of STATA functions to store your
results to create tables in Excel.
First I run the command to create my matrix (stored as “ms”)
tab AGER MARSTAT if inlist(MARSTAT,1,2) & (AGER>=18 & AGER<=34),
matcell(ms
)
Then I tell excel to put that whole matrix, starting in cell B3.
putexcel B4 = matrix(ms), nformat(##)
Formulas
Suppose you want to calculate rates from values you added from a matrix.
Here I show how to calculate marriage rate from the number of marriages
and sample size for each age.
My marriages are in column B and sample is in column D, so I want to
calculate column E (the rate) as B divided by D (I multiple by 100 to show as a
percentage)
forvalues row = 4/20 {putexcel E`row' = formula(+100*B`row' / D`row'), nformat(##.#)
putexcel F`row' = formula(+100*C`row' / D`row'), nformat(##.#)
}
Output: The cell displays the output of the formula, but when I click into the
cell, I see the formula I entered in STATA.
Results of a command
You can also leverage STATA’s results storage functional to input results from a
prior function – like a mean or sample size.
Suppose I want to know the mean educational attainment for each age in my
sample. I first run the summarize command to get the mean education, then
leverage r(mean) to populate that result in Excel. Note: STATA only stores the
result for the most recently run command, hence why I looped to calculate and
export one age at a time.
forvalues age=18/34 {local row=`age'-14
summarize HIEDUC if AGER==`age'
putexcel G`row'=`r(mean)'
}
Images or graphs
Putexcel allows you to input a saved graph. You first have to run
the command to create your graph, then save the graph. Then
use putexcel to call that graph and place in a cell (the cell
reference corresponds to the top left corner of your graph).
line educ AGER if AGER>=18 & AGER<=34
graph export age.png, replace
putexcel J6 = image(age.png)
Results of an estimation
Similar to other stored results, you can input results from an estimation command or model
into excel. You can have STATA export the full output with all columns, or leverage a matrix to
just export the coefficients. You first have to run your command; etable automatically calls the
full results table. To get just coefficients, you need to save your results in a matrix first.
Other tools, like outreg2, also allow you to do this. That topic is covered elsewhere.
regress HIEDUC MOMDEGRE
putexcel A25 = etable
putexcel A29 = "Coefficients"
matrix b = e(b)'
putexcel A30 = matrix(b)
Formatting options
Number format
putexcel B1 = 1025.49, nformat(##.#)
putexcel B2 = 1025.49, nformat(##.##)
putexcel B3 = 1025.49, nformat(##)
putexcel B4 = 1025.49, nformat(#,#)
Cell format
putexcel B6 = "Bold", bold
putexcel B7 = "Italic", italic
putexcel B8 = "Underline", underline
putexcel B9 = "hotpink", font(Arial, 16, "hotpink")
putexcel B10 = "turquoise", fpattern("solid", "mediumturquoise")putexcel B11 = "border", border(all, "medium_dashed", "slateblue")
putexcel B12 = "Comic Sans MS", font("Comic Sans MS")Cell alignment and merging
putexcel B14 = "Center", hcenter
putexcel B15 = "Indent", txtindent(5)
putexcel B16:E16= "Merge Merge Merge", merge
Related function: putdocx
Syntax
Putdocx starts a bit differently than putexcel. First you have to tell STATA to start creating a doc:
putdocx begin
Next you have to create a paragraph and input text.
putdocx paragraph, style(Heading1)
putdocx text ("Marital Status")Now I want to create a sentence listing my sample, but I want STATA to calculate it for me. I can leverage STATA stored results by first summarizing my sample, then
using r(N) to call the total.
putdocx paragraph
summarize FMARIT
putdocx text ("We have the marital status for `r(N)' women")To finish, you have to tell STATA to save your file, which creates the .docx for you. Note, each time you save, STATA stops recording in your .docx, so you need to tell
STATA to open if you want to edit.
putdocx save "MaritalStatusReport", replace
Note: can also do putpdf, which uses the same syntax as putdocx but creates a .pdf instead of a document
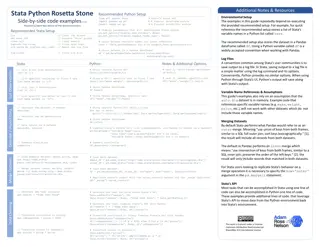
What are dynamic documents?
Dynamic documents allow you to create documents that contain both static, formatted text as well as
Stata commands, so you can dynamically populate with results of many Stata commands, from simple
tabulation to advanced models. The dyndoc command converts this document (which is written in
Markdown format) to either an HTML file or Word document. This is similar to putdoc , but allows for
more functionality. If your data ever changes or you add different sample restrictions, this makes it very
easy to update your output automatically without manual corrections needed.
Logistics
You start your file with all of your basic Stata code and syntax as you normally would, but there are a
few things needed to make this a truly dynamic document.
Firstly, when it comes to the code writing, there is certain annotation needed so Stata knows not to
output the code, unless you want it do, and how to run the code in the context of your intended output.
Secondly, you’ll often pepper in text throughout the file that you want to display, so perhaps you have a
paragraph on your data and methods that you also dynamically insert sample sizes into. Or maybe you
want to describe a table of results before you paste in in, or add some formatted headings to split up
the page.
I like to write in a .do file to start to ensure all the code works properly then paste into a file to save as
markdown. As a note, markdown needs to be read with a text editor.
Writing code
For the most part, you’ll surround your code with <<dd_do>> and finish with <</dd_do>>. If you don’t want Stata to run the
code at all in the command window, you can start with <<dd_do: quietly>> instead.
<<dd_do: quietly>>
use "T:\Research Projects\NSFG\Divorce\data_keep\divorce_ 6 Apr 2020.dta", clear
egen ss=count(1)
local total_sample = ss
keep if agemar < 36 & retro < 10 & yrmar <=115 & mcohort > 0
egen fs=count(1)
local final_sample = fs
<</dd_do>>
sometimes you might want to include your code in the output, so it’s evident what you did. To do that, you surround your code
with four tildes (~).
~~~~
logistic sepdiv i.dur ib2.mcohort [pweight=weight]
logistic sepdiv i.dur ib2.mcohort i.educ [pweight=weight]
~~~~
Converting your document
You can create an .html page from your dynamic document.
dyndoc
"dyndoc_example.md",
saving(dyndoc_example.html) replace
You can also create a Word document. This automatically saves the .docx with the name of the .md file
dyndoc "dyndoc_example.md", docx replace
Populating stored results
One very useful function of dynamic documents is assistance with easily filling in data & methods or results
sections of papers leveraging Stata output directly, without needing to worry about manual data entry.
<<dd_do: quietly>>
keep if agemar < 36 & retro < 10 & yrmar <=115 & mcohort > 0
egen fs=count(1)
local final_sample = fs
<</dd_do>>
### Introduction
Restricting to marriages began between 2000 and 2014 to women no older than age 35 and within 10 years of
the interview reduces the sample to
**<<dd_display: %5.0fc `final_sample'>>**
women.
Tables: using tabulate
You can specific “markdown” as an option in the
tabulate command to automatically insert the results
into your markdown file. You’ll want to ensure your
variables are labelled nicely, since that’s what Stata will
use in the output.
<<dd_do: nocommands>>
label variable educ "Educational Attainment”
label variable mcohort "Marital Cohort"
tabulate mcohort educ, row nofreq markdown
<</dd_do>>
Tables: using tabout
This option similarly exports results of tabulation or cross-tabulation, but
allows for a bit more flexibility in formatting. As such, a bit more code is
needed to format the table, as well as insert the final table into your
document. You list what variables you want to tabulate and where you
want it saved, then all of your formatting options. Then you use dynamic
tags to insert. See the annotated .do file for explanations of the
formatting options.
<<dd_do: quietly>>
quietly tabout mcohort educ using educ.html, replace ///
style(htm) font(italic) h1(Education) c(row) f(0p) layout(rb) summary ///
twidth(9) title(% Educational Attainment by Cohort) clab(_ _ ) ///
npos(row) nlab(Sample Size)
<</dd_do>>
<<dd_include: educ.html>>
Tables: manual table creation
Using a series of pipes | and dashes -, you can build your own table in your document. You
might do this if you can’t easily run one command to create and output the data you
wanted. In this example, I wanted to display age at marriage for each marital cohort, using
a local macro that stored mean age. With this approach, you have the flexibility to add
your own text as well as use Stata function results.
<div align="center">
<h5> Age at Marriage by Cohort </h5>
</div>
<div align="center">
| Cohort | Marriage Age |
|:----------:|:----------------------------:|
| 2000-2004: | <<dd_di: %6.2f $agemar0004>> |
| 2005-2009: | <<dd_di: %6.2f $agemar0509>> |
| 2010-2014: | <<dd_di: %6.2f $agemar1014>> |
</div>
Results of an estimation
Using the
eststo
and
esttab
functions, you can easily input a nicely formatted results
table from any models you run in Stata. Before each model you run, you begin the line of
code with
eststo
so Stata knows to store the results of the estimation. Once you’ve run
all of the models you want, you can create a table with all stores results, which you can
also format, add titles, labels, etc. Note:
eststo
will continue to store results until you tell
it to clear all stored data, so ensure you clear before you run the models you want
included in your table.
<<dd_do: quietly>>
eststo clear
eststo: logistic sepdiv i.durmar ib2.mcohort [pweight=weight]
eststo: logistic sepdiv i.durmar ib2.mcohort i.educ [pweight=weight]
esttab using estimates.html, pr2 se label nogaps compress title("Logged Odds ofDivorce") replace
<</dd_do>>
<<dd_include: estimates.html>>
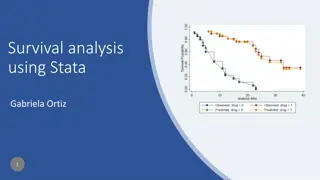
Images or graphs
Perhaps once you’ve run your estimation above, you want to create a plot
of predicted probabilities. You can create a
marginsplot
, then use the
dynamic graph capabilities, which tells Stata to input the most recently
created grasph into the document. You can also input saved graphs and
images, as long as you tell Stata where they are stored.
<<dd_do: quietly>>
logistic sepdiv i.durmar ib2.mcohort i.educ [pweight=weight]
margins, at(mcohort=(1(1)3) educ=(1(1)4)) atmeans
marginsplot, noci title("Predicted Probabilities of Divorce by Educationover Time") xtitle("Marital Cohort") ylabel(, angle(0)) ytitle("DivorceProbability") plotregion(fcolor(white)) graphregion(fcolor(white))
legend(region(lcolor(white))) recast(line)
<</dd_do>>
<<dd_graph:>>
What is outreg2?
Outreg2 is a Stata package that allows you to handily export results of your estimations in paper-ready
formats. You can display many statistics options, the basic coefficient and standard errors, to confidence
intervals, p-values, and much more.
You can outreg2 to either Excel or Word; the options are all the same, just the file format changes.
Note: outreg2 needs to be installed; it is not built into Stata; you can install by typing:
ssc install outreg2
Basic syntax
First run your estimation command:
svy: logit EVRMARRY cycle, or
Then run your outreg command. Statistics are discussed more below, but the default option is to display
the coefficients and standard errors of your estimation. If you are adding multiple models, in your first
specification of outreg2, you’ll want to use
replace
at the end, to tell Excel to start a new file.
outreg2 using "
outreg_example.doc
", cttop(
Model 1
)
replace
Then if you want to add another model, where you want to see the effects of another variable, you run
that model, the outreg2, then specify the same file name, just with
append
at the end. You’ll also likely
want to label your models so you know which is which in the export (the
cttop
part of the command).
svy: logit EVRMARRY cycle HIEDUC AGER, or
outreg2 using "
outreg_example.doc
", cttop(
Model 2
)
append
Basic output
Common options
•
label:
use variable label instead of name
•
statistics:
Choose which statistics you display (coefficient and standard error are the defaults); use the option
stats(option1 option2 option3…)
•
eform
:
Sometimes when you run certain models, you can specify options for Stata to display the coefficients in a
different format (e.g. odds ratio); use
eform
to use the same option in outreg2
•
alphas
:
The default of outreg2 is to use a 3 star asterisk system for statistical significance of (.01, .05, .10), which
is not the standard for most journals. To change to the standard use
alpha(0.001, 0.01, 0.05).
•
alphas pt 2:
If you don’t want outreg2 to include asterisks at all for significance, use
noaster
•
footnotes:
If you want to add your own footnotes to the output, such as a source or sample restriction, use
addnote(“note text”).
Note: you can only do this in first outreg.
•
number formatting:
You can specify the number of decimal places you show in the output; can change for all
values (dec#), or can specify just for certain statistics (e.g. pdec(#) for p-value)
•
sideway:
This option puts the additional statistics beyond your coefficient (such as standard error or p-value)
next to the coefficient, instead of underneath, the default.
This code has all of the above options:
outreg2 using "outreg_example.xls", sideway stats(coef pval) label noaster
addnote("Source:NSFG 2014-2017") dec(2) cttop("sideways") eform appendExamples of common options
Statistics options
coef se tstat pval ci ci_low ci_high beta N sum_w mean Var sd sum min max skewness kurtosis p1 p5
p10 p25 p50 p75 p90 p95 p99 range iqr cv semean median count corr covar pcorr semipcorr pcorrpval
spearman tau_a tau_b
(See help outreg2 for a description of each).
If you don’t specify, the default is
coef
and
se
(the
model
coefficients and standard errors).
Options
appear in the order you write them.
Helpful Resources
•
Putexcel
-
Stata manual: https://www.stata.com/manuals/rptputexcel.pdf#rptputexcel
•
Dynamic Documents
-
Stata manuals:
o
Dynamic tags:
https://www.stata.com/manuals/rptdynamictags.pdf#rptDynamictags
o
Converting documents: https://www.stata.com/manuals/rptdyndoc.pdf#rptdyndoc
o
Stata reference built using dynamic documents: https://www.stata.com/features/overview/markdown/
-
Helpful references on Markdown formatting (e.g. how to bold, change font size, etc.)
o
https://www.markdownguide.org/basic-syntax/
o
https://simplpost.com/markdown.html
o
https://help.smash.gg/en/articles/1987102-customizing-text-with-markdown
-
Some people have written entire articles in Markdown!
o
See paper here: https://www.demographic-research.org/volumes/vol36/31/36-31.pdf
o
And documentation here: https://data.princeton.edu/stata/markdown/wfsx
-
There are also similar Stata programs built by others with additional or streamlined functionality
o
Markstat is primarily used:
https://data.princeton.edu/stata/markdown
- is a great resource with a lot of examples
•
Outreg2
-
Typing “help outreg2” in Stata is most comprehensive guide
Email us at
consultants@prc.utexas.edu
!
https://liberalarts.utexas.edu/prc/_scientific-and-technical/data-
science/statistical-consulting.php
Learn how to utilize the PutExcel feature in STATA to effortlessly export your results to an Excel file. With PutExcel, you can export matrices, stored results, images, estimation tables, and even add formulas for calculations. This tool streamlines the process of transferring statistical data to Excel, reducing the risk of manual errors. Discover the basic syntax, creating matrices, and incorporating formulas for efficient data exporting.

Download Presentation

Please find below an Image/Link to download the presentation.
The content on the website is provided AS IS for your information and personal use only. It may not be sold, licensed, or shared on other websites without obtaining consent from the author. Download presentation by click this link. If you encounter any issues during the download, it is possible that the publisher has removed the file from their server.
E N D
Presentation Transcript
STATA TIPS & TRICKS EXPORTING DATA TO EXCEL AND WORD
Options we will cover today Putexcel Dynamic Documents Outreg2
What is putexcel? PutExcel allows you to easily export STATA results to an Excel file. You can export matrices, stored results, images, and estimation tables, as well as add your own formulas to calculate fields. This is helpful if you a series of descriptive statistics, rates, or things like lifetables that you want to easily transfer to Excel, without risk of errors from manual entry. PutExcel also supports a variety of cell and number formatting options. You can add your own static text as well for things such as labelling.
Basic syntax To start, you first need to tell STATA what workbook (and, optionally, sheet) you want to put your results in. If you don t specify a sheet, Excel will use Sheet1 putexcel set "T:\Third Semester Classes\PRC TA Work\MaritalStatusData", sheet(summary) replace Next, it s best practice to label your cells so you can place your data appropriately. You can manually write in text, or use formulas or macros to populate cells. In the below example, we are telling STATA to label cells B2 to F2 with different text we specified. putexcel B2 = "Marriages" C2 = "Cohabitations" D2 = "Sample" E2 = "Marriage Rate" F2 = "Cohabitation Rate"
Matrices You can create matrices from a variety of STATA functions to store your results to create tables in Excel. First I run the command to create my matrix (stored as ms ) tab AGER MARSTAT if inlist(MARSTAT,1,2) & (AGER>=18 & AGER<=34), matcell(ms) Then I tell excel to put that whole matrix, starting in cell B3. putexcel B4 = matrix(ms), nformat(##)
Formulas Suppose you want to calculate rates from values you added from a matrix. Here I show how to calculate marriage rate from the number of marriages and sample size for each age. My marriages are in column B and sample is in column D, so I want to calculate column E (the rate) as B divided by D (I multiple by 100 to show as a percentage) forvalues row = 4/20 { putexcel E`row' = formula(+100*B`row' / D`row'), nformat(##.#) putexcel F`row' = formula(+100*C`row' / D`row'), nformat(##.#) } Output: The cell displays the output of the formula, but when I click into the cell, I see the formula I entered in STATA.
Results of a command You can also leverage STATA s results storage functional to input results from a prior function like a mean or sample size. Suppose I want to know the mean educational attainment for each age in my sample. I first run the summarize command to get the mean education, then leverage r(mean) to populate that result in Excel. Note: STATA only stores the result for the most recently run command, hence why I looped to calculate and export one age at a time. forvalues age=18/34 { local row=`age'-14 summarize HIEDUC if AGER==`age' putexcel G`row'=`r(mean)' }
Images or graphs Putexcel allows you to input a saved graph. You first have to run the command to create your graph, then save the graph. Then use putexcel to call that graph and place in a cell (the cell reference corresponds to the top left corner of your graph). line educ AGER if AGER>=18 & AGER<=34 graph export age.png, replace putexcel J6 = image(age.png)
Results of an estimation Similar to other stored results, you can input results from an estimation command or model into excel. You can have STATA export the full output with all columns, or leverage a matrix to just export the coefficients. You first have to run your command; etable automatically calls the full results table. To get just coefficients, you need to save your results in a matrix first. Other tools, like outreg2, also allow you to do this. That topic is covered elsewhere. regress HIEDUC MOMDEGRE putexcel A25 = etable putexcel A29 = "Coefficients" matrix b = e(b)' putexcel A30 = matrix(b)
Formatting options Number format putexcel B1 = 1025.49, nformat(##.#) putexcel B2 = 1025.49, nformat(##.##) putexcel B3 = 1025.49, nformat(##) putexcel B4 = 1025.49, nformat(#,#) Cell format putexcel B6 = "Bold", bold putexcel B7 = "Italic", italic putexcel B8 = "Underline", underline putexcel B9 = "hotpink", font(Arial, 16, "hotpink") putexcel B10 = "turquoise", fpattern("solid", "mediumturquoise") putexcel B11 = "border", border(all, "medium_dashed", "slateblue") putexcel B12 = "Comic Sans MS", font("Comic Sans MS") Cell alignment and merging putexcel B14 = "Center", hcenter putexcel B15 = "Indent", txtindent(5) putexcel B16:E16= "Merge Merge Merge", merge
Related function: putdocx Syntax Putdocx starts a bit differently than putexcel. First you have to tell STATA to start creating a doc: putdocx begin Next you have to create a paragraph and input text. putdocx paragraph, style(Heading1) putdocx text ("Marital Status") Now I want to create a sentence listing my sample, but I want STATA to calculate it for me. I can leverage STATA stored results by first summarizing my sample, then using r(N) to call the total. putdocx paragraph summarize FMARIT putdocx text ("We have the marital status for `r(N)' women") To finish, you have to tell STATA to save your file, which creates the .docx for you. Note, each time you save, STATA stops recording in your .docx, so you need to tell STATA to open if you want to edit. putdocx save "MaritalStatusReport", replace Note: can also do putpdf, which uses the same syntax as putdocx but creates a .pdf instead of a document
What are dynamic documents? Dynamic documents allow you to create documents that contain both static, formatted text as well as Stata commands, so you can dynamically populate with results of many Stata commands, from simple tabulation to advanced models. The dyndoc command converts this document (which is written in Markdown format) to either an HTML file or Word document. This is similar to putdoc , but allows for more functionality. If your data ever changes or you add different sample restrictions, this makes it very easy to update your output automatically without manual corrections needed.
Logistics You start your file with all of your basic Stata code and syntax as you normally would, but there are a few things needed to make this a truly dynamic document. Firstly, when it comes to the code writing, there is certain annotation needed so Stata knows not to output the code, unless you want it do, and how to run the code in the context of your intended output. Secondly, you ll often pepper in text throughout the file that you want to display, so perhaps you have a paragraph on your data and methods that you also dynamically insert sample sizes into. Or maybe you want to describe a table of results before you paste in in, or add some formatted headings to split up the page. I like to write in a .do file to start to ensure all the code works properly then paste into a file to save as markdown. As a note, markdown needs to be read with a text editor.
Writing code For the most part, you ll surround your code with <<dd_do>> and finish with <</dd_do>>. If you don t want Stata to run the code at all in the command window, you can start with <<dd_do: quietly>> instead. <<dd_do: quietly>> use "T:\Research Projects\NSFG\Divorce\data_keep\divorce_ 6 Apr 2020.dta", clear egen ss=count(1) local total_sample = ss keep if agemar < 36 & retro < 10 & yrmar <=115 & mcohort > 0 egen fs=count(1) local final_sample = fs <</dd_do>> sometimes you might want to include your code in the output, so it s evident what you did. To do that, you surround your code with four tildes (~). ~~~~ logistic sepdiv i.dur ib2.mcohort [pweight=weight] logistic sepdiv i.dur ib2.mcohort i.educ [pweight=weight] ~~~~
Converting your document You can create an .html page from your dynamic document. dyndoc "dyndoc_example.md", saving(dyndoc_example.html) replace You can also create a Word document. This automatically saves the .docx with the name of the .md file dyndoc "dyndoc_example.md", docx replace
Populating stored results One very useful function of dynamic documents is assistance with easily filling in data & methods or results sections of papers leveraging Stata output directly, without needing to worry about manual data entry. <<dd_do: quietly>> keep if agemar < 36 & retro < 10 & yrmar <=115 & mcohort > 0 egen fs=count(1) local final_sample = fs <</dd_do>> ### Introduction Restricting to marriages began between 2000 and 2014 to women no older than age 35 and within 10 years of the interview reduces the sample to **<<dd_display: %5.0fc `final_sample'>>** women.
Tables: using tabulate You can specific markdown as an option in the tabulate command to automatically insert the results into your markdown file. You ll want to ensure your variables are labelled nicely, since that s what Stata will use in the output. <<dd_do: nocommands>> label variable educ "Educational Attainment label variable mcohort "Marital Cohort" tabulate mcohort educ, row nofreq markdown <</dd_do>>
Tables: using tabout This option similarly exports results of tabulation or cross-tabulation, but allows for a bit more flexibility in formatting. As such, a bit more code is needed to format the table, as well as insert the final table into your document. You list what variables you want to tabulate and where you want it saved, then all of your formatting options. Then you use dynamic tags to insert. See the annotated .do file for explanations of the formatting options. <<dd_do: quietly>> quietly tabout mcohort educ using educ.html, replace /// style(htm) font(italic) h1(Education) c(row) f(0p) layout(rb) summary /// twidth(9) title(% Educational Attainment by Cohort) clab(_ _ ) /// npos(row) nlab(Sample Size) <</dd_do>> <<dd_include: educ.html>>
Tables: manual table creation Using a series of pipes | and dashes -, you can build your own table in your document. You might do this if you can t easily run one command to create and output the data you wanted. In this example, I wanted to display age at marriage for each marital cohort, using a local macro that stored mean age. With this approach, you have the flexibility to add your own text as well as use Stata function results. <div align="center"> <h5> Age at Marriage by Cohort </h5> </div> <div align="center"> | Cohort | Marriage Age | |:----------:|:----------------------------:| | 2000-2004: | <<dd_di: %6.2f $agemar0004>> | | 2005-2009: | <<dd_di: %6.2f $agemar0509>> | | 2010-2014: | <<dd_di: %6.2f $agemar1014>> | </div>
Results of an estimation Using the eststo and esttab functions, you can easily input a nicely formatted results table from any models you run in Stata. Before each model you run, you begin the line of code with eststo so Stata knows to store the results of the estimation. Once you ve run all of the models you want, you can create a table with all stores results, which you can also format, add titles, labels, etc. Note: eststo will continue to store results until you tell it to clear all stored data, so ensure you clear before you run the models you want included in your table. <<dd_do: quietly>> eststo clear eststo: logistic sepdiv i.durmar ib2.mcohort [pweight=weight] eststo: logistic sepdiv i.durmar ib2.mcohort i.educ [pweight=weight] esttab using estimates.html, pr2 se label nogaps compress title("Logged Odds of Divorce") replace <</dd_do>> <<dd_include: estimates.html>>
Images or graphs Perhaps once you ve run your estimation above, you want to create a plot of predicted probabilities. You can create a marginsplot, then use the dynamic graph capabilities, which tells Stata to input the most recently created grasph into the document. You can also input saved graphs and images, as long as you tell Stata where they are stored. <<dd_do: quietly>> logistic sepdiv i.durmar ib2.mcohort i.educ [pweight=weight] margins, at(mcohort=(1(1)3) educ=(1(1)4)) atmeans marginsplot, noci title("Predicted Probabilities of Divorce by Education over Time") xtitle("Marital Cohort") ylabel(, angle(0)) ytitle("Divorce Probability") plotregion(fcolor(white)) graphregion(fcolor(white)) legend(region(lcolor(white))) recast(line) <</dd_do>> <<dd_graph:>>
What is outreg2? Outreg2 is a Stata package that allows you to handily export results of your estimations in paper-ready formats. You can display many statistics options, the basic coefficient and standard errors, to confidence intervals, p-values, and much more. You can outreg2 to either Excel or Word; the options are all the same, just the file format changes. Note: outreg2 needs to be installed; it is not built into Stata; you can install by typing: ssc install outreg2
Basic syntax First run your estimation command: svy: logit EVRMARRY cycle, or Then run your outreg command. Statistics are discussed more below, but the default option is to display the coefficients and standard errors of your estimation. If you are adding multiple models, in your first specification of outreg2, you ll want to use replace at the end, to tell Excel to start a new file. outreg2 using "outreg_example.doc", cttop(Model 1) replace Then if you want to add another model, where you want to see the effects of another variable, you run that model, the outreg2, then specify the same file name, just with append at the end. You ll also likely want to label your models so you know which is which in the export (the cttop part of the command). svy: logit EVRMARRY cycle HIEDUC AGER, or outreg2 using "outreg_example.doc", cttop(Model 2) append
Common options label: use variable label instead of name statistics: Choose which statistics you display (coefficient and standard error are the defaults); use the option stats(option1 option2 option3 ) eform: Sometimes when you run certain models, you can specify options for Stata to display the coefficients in a different format (e.g. odds ratio); use eform to use the same option in outreg2 alphas: The default of outreg2 is to use a 3 star asterisk system for statistical significance of (.01, .05, .10), which is not the standard for most journals. To change to the standard use alpha(0.001, 0.01, 0.05). alphas pt 2: If you don t want outreg2 to include asterisks at all for significance, use noaster footnotes: If you want to add your own footnotes to the output, such as a source or sample restriction, use addnote( note text ). Note: you can only do this in first outreg. number formatting: You can specify the number of decimal places you show in the output; can change for all values (dec#), or can specify just for certain statistics (e.g. pdec(#) for p-value) sideway: This option puts the additional statistics beyond your coefficient (such as standard error or p-value) next to the coefficient, instead of underneath, the default. This code has all of the above options: outreg2 using "outreg_example.xls", sideway stats(coef pval) label noaster addnote("Source:NSFG 2014-2017") dec(2) cttop("sideways") eform append
Statistics options coef se tstat pval ci ci_low ci_high beta N sum_w mean Var sd sum min max skewness kurtosis p1 p5 p10 p25 p50 p75 p90 p95 p99 range iqr cv semean median count corr covar pcorr semipcorr pcorrpval spearman tau_a tau_b (See help outreg2 for a description of each). If you don t specify, the default is coef and se (the model coefficients and standard errors). Options appear in the order you write them.
Helpful Resources Putexcel Stata manual: https://www.stata.com/manuals/rptputexcel.pdf#rptputexcel - Dynamic Documents Stata manuals: o Dynamic tags: https://www.stata.com/manuals/rptdynamictags.pdf#rptDynamictags o Converting documents: https://www.stata.com/manuals/rptdyndoc.pdf#rptdyndoc o Stata reference built using dynamic documents: https://www.stata.com/features/overview/markdown/ Helpful references on Markdown formatting (e.g. how to bold, change font size, etc.) o https://www.markdownguide.org/basic-syntax/ o https://simplpost.com/markdown.html o https://help.smash.gg/en/articles/1987102-customizing-text-with-markdown Some people have written entire articles in Markdown! o See paper here: https://www.demographic-research.org/volumes/vol36/31/36-31.pdf o And documentation here: https://data.princeton.edu/stata/markdown/wfsx There are also similar Stata programs built by others with additional or streamlined functionality o Markstat is primarily used: https://data.princeton.edu/stata/markdown - is a great resource with a lot of examples - - - - Outreg2 Typing help outreg2 in Stata is most comprehensive guide -
NEED FURTHER HELP? Email us at consultants@prc.utexas.edu! https://liberalarts.utexas.edu/prc/_scientific-and-technical/data- science/statistical-consulting.php