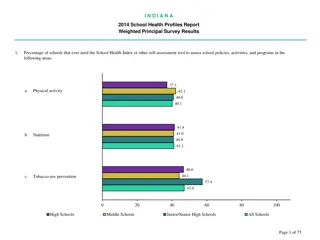
JPS Health Network Long-Range Planning Report
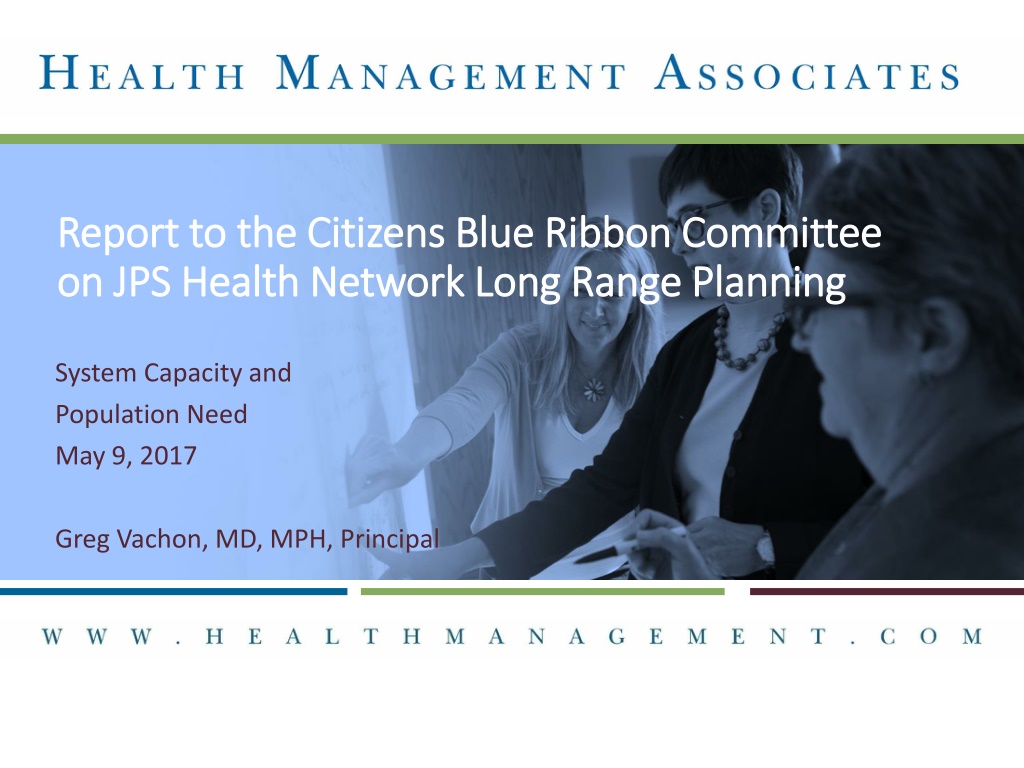
The report to the Citizens Blue Ribbon Committee highlights the current system capacity and population needs of the JPS Health Network. It emphasizes the challenge of meeting the increasing demands of target populations, advocates for strengthening primary care and preventive services, and explores alternative plans to address the unmet needs. The framework presented delves into the total needs of the target population and the capacity of JPS to meet them, ultimately suggesting strategies to enhance service delivery for better community health outcomes.

Download Presentation

Please find below an Image/Link to download the presentation.
The content on the website is provided AS IS for your information and personal use only. It may not be sold, licensed, or shared on other websites without obtaining consent from the author. Download presentation by click this link. If you encounter any issues during the download, it is possible that the publisher has removed the file from their server.
E N D
Presentation Transcript
Report to the Citizens Blue Ribbon Committee Report to the Citizens Blue Ribbon Committee on JPS Health Network Long Range Planning on JPS Health Network Long Range Planning System Capacity and Population Need May 9, 2017 Greg Vachon, MD, MPH, Principal
SYSTEM CAPACITY AND POPULATION NEED Key points Current needs of target populations far exceed the capacity Capacity cannot be increased to point of meeting all projected need: future need must be partially met through delivery system changes Primary care and other preventive efforts must be strengthened in order to decrease demand for downstream services 2
FRAMEWORK FOR DEFINING CAPACITY AND NEED: POPULATION VIEW Need of target population Total Need There are significant unmet needs, even if total specialists in Tarrant County may be adequate Unmet needs Example: 2 million people need 80 cardiologists 30 Cardiologists Other systems Other systems fulfill unknown amount of the need JPS Capacity of JPS could meet 26% of need in target population capacity Target population need 3
USING TODAYS PERCENTAGE TO DEFINE PLANS Absolute unmet need increases Unmet needs Other systems Number of cardiologists needed to have capacity to serve same percentage 26% 26% 26% In 10 years In 20 years Now 4
ALTERNATIVE: PLAN TO MEET NEED, AS A COUNTY Decrease need through technology Potential to reach 100% Create partnerships to enable other systems to similarly increase percentage of service Unmet needs Other systems Capacity needed to serve higher percentage In 10 years In 20 years Now 5
A PART OF MODEL (EXCEPT BEDS) ASSUMES ALL CAPACITY IS DIRECTED TOWARDS THE TARGET POPULATION Need of target population Total Need Example: 2 million people need 80 cardiologists <250 FPL Need 31 Portion of population actually served is less than 26% - only that under the curve Target population need JPS capacity 8 cardiologists but serve patient mix above and below 250 FPL 6
PRIMARY CARE IN ALL OF TARRANT COUNTY 2017 2022 2027 2032 2037 Total Needed FTEs 1,043 1,168 1,294 1,437 1,581 Estimated number of primary care physicians in Tarrant County 778 Percent of need 75% Non-physician PCPs likely make up some of 25%, but data consistent with low primary care capacity 25 FTEs of net PCPs per year will be needed in Tarrant in next five years 1,168 1,043 = 125 5 years = 25 per year 7
PRIMARY CARE NEEDS FOR POPULATION < 250% FPL COMPARED TO JPS CAPACITY 2017 2022 2027 2032 2037 Total Needed FTEs 378 423 469 521 573 Number of JPS FTEs to continue same coverage 98 110 122 135 149 (current) Percent of demand met 26% 26% 26% 26% 26% Number of JPS FTEs needed to reach 50% in 20 years 98 135 178 229 287 (current) Percent of demand met 26% 32% 38% 44% 50% Primary care is needed as one foundation to achieving prevention, lower hospital rates Major training, recruiting and retention of PCPs is essential Concurrent primary care facility expansion/additions will be needed 8
SPECIALTY NEED FOR POPULATION < 250% FPL Zero to 30 Scale to 100 100 30 90 25 80 70 20 60 50 15 40 10 30 20 5 10 0 0 9
SPECIALTY TAKE HOME Specialty access is poor for target population Long waits of months for non-urgent new appointments On average, the percent of population need met by JPS is 27% (similar to primary care) but varies by specialty Planning for expansion must be much more than meeting a particular percentage of population need. Need to assess: Pediatrics versus adult drivers of need Other institutions capacity and willingness to meet needs Ability to attract other payers (degree of subsidy) Impact of unmet needs per specialty 10
PSYCHIATRIC BEDS: PUBLIC BED NEED IN TARRANT COUNTY 2017 2022 2027 2032 2037 Best evidence: 70 public beds/100,000 1,414 1,568 1,722 1,893 2,064 Investments in comprehensive behavioral health supports 707 784 861 947 1,032 Beds if 50% of need met by JPS 354 392 431 473 516 JPS actual beds 132 132 132 132 132 Percent of the 50% 37% 34% 31% 28% 26% Current beds are woefully inadequate to meet population needs Three keys: prevent need/demand (county-wide efforts to prevent mental health problems, identify and treat early in accessible ambulatory settings) optimize use of beds (e.g., complex patients at JPS) build inpatient capacity 11
ACUTE MEDICAL BEDS 2017 2022 2027 2032 2037 Beds per thousand if no further capacity built in Tarrant County 2.0 1.8 1.7 1.5 1.4 Likely beds needed with current downward trends (assumes investment) n/a 1.92 1.82 1.73 1.65 Total beds needed in all Tarrant County n/a 219 404 603 770 Beds needed for the new population <250% FPL at final rate of 1.65 per 1,000 n/a 154 307 478 648 Investment in primary care and care management need to be made to lower bed utilization rates Target population bed needs will need to continue to be met by multiple institutions 12
ANALYSIS OF TARGET POPULATIONS ACUTE MEDICAL BED NEED AT JPS JPS Connection and Medicare < 250% FPL 2017 2022 2027 2032 2037 Beds per thousand adjusted for payer mix and expected bed need reduction 1.547 1.560 1.563 1.563 1.553 Total beds needed for target population 659 737 810 890 964 JPS beds likely available (based on 55.1% of beds to Medicare, Connection, Self Pay) 224 224 224 224 224 Percent of need met for target population 34% 30% 28% 25% 23% Aging population keeps bed rate steady Without increasing beds current shortage evidenced by ER holding will be severely exacerbated 13
SYSTEM CAPACITY AND POPULATION NEEDS Question and Answer Discussion 14


 ASSUMES ALL CAPACITY IS")