Addressing Faculty Salary Compression Issues in Higher Education
Faculty salary compression has become a significant challenge in higher education, particularly affecting long-serving faculty members. This issue arises from repeated freezes on the salaries of existing faculty while new hires receive higher market rates. General pay increases and merit processes do not effectively resolve compression, necessitating targeted efforts to address cohorts of affected faculty. The accumulation of freezes can result in substantial pay cuts for faculty members, illustrating the need for specific strategies to alleviate the problem.

Download Presentation

Please find below an Image/Link to download the presentation.
The content on the website is provided AS IS for your information and personal use only. It may not be sold, licensed, or shared on other websites without obtaining consent from the author. Download presentation by click this link. If you encounter any issues during the download, it is possible that the publisher has removed the file from their server.
E N D
Presentation Transcript
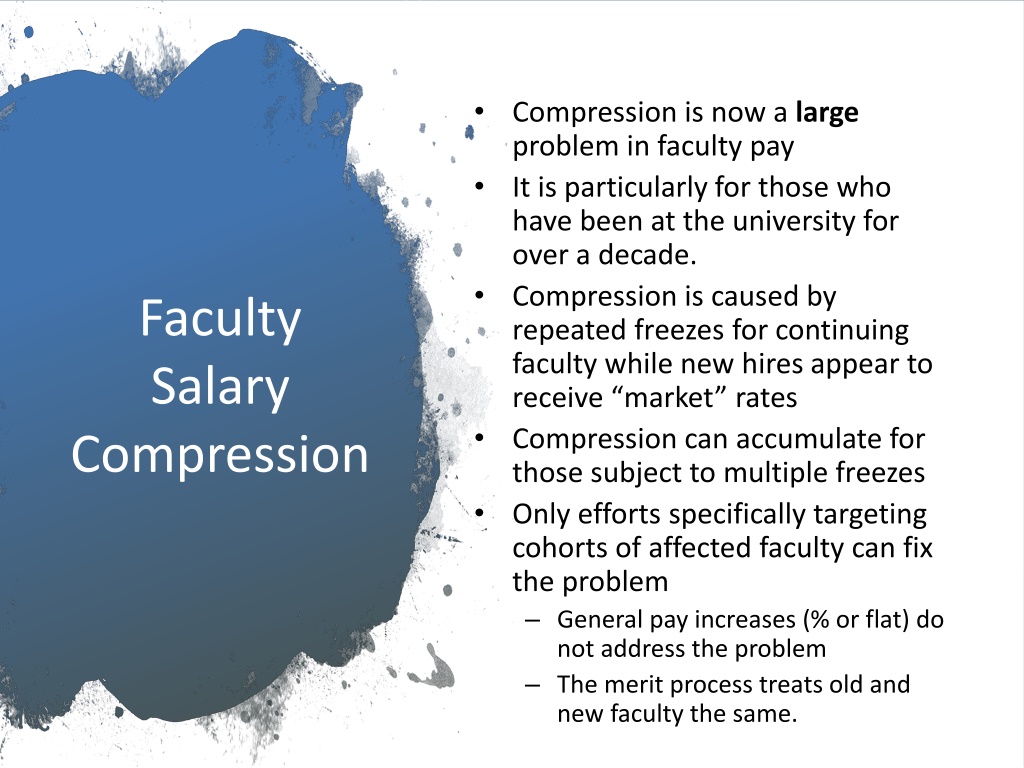
Compression is now a large problem in faculty pay It is particularly for those who have been at the university for over a decade. Compression is caused by repeated freezes for continuing faculty while new hires appear to receive market rates Compression can accumulate for those subject to multiple freezes Only efforts specifically targeting cohorts of affected faculty can fix the problem General pay increases (% or flat) do not address the problem The merit process treats old and new faculty the same. Faculty Salary Compression
51% of the tenure-track faculty have taken 6 freezes in the last 12 years, an effective pay of cut about 30% Faculty Salary Compression 100 Over half of tenure-track faculty have experienced 6 zeros since 2008 Tenured/Tenure-track 90 80 70 percentage 60 50 40 30 20 10 0 1 zero year (2018) 2 zeros (2017) 3 zeros (2016) 4 zeros (2012) 5 zeros (2011) 6 zeros (2009) 7 zeros (2003) 8 zeros (1993)
Faculty Salary Compressio n A hypothetical professor hired in as a new assistant in 2000 at the average entry salary, promoted in 2008 to associate professor and to full professor in 2016. Due to cumulative effects of 6 pay freezes, an individual receiving typical raises promotion increases for associate and full plus 3% GWI and 1.65% merit raise in each non-freeze year-- earns LESS than average entry salary of new assistant professors since 2017. Had historic raises been paid in all 6 zero years, this individual s salary would be over 35% higher than a new assistant. Source: UConn payroll records, past AAUP contracts
Salary Compression of salaries is caused by pay freezes & hiring pracices 1.70 1.60 1.50 Ratio of averages 1.40 1.30 1.20 1.10 1.00 0.90 2003 2004 2005 2006 2007 2008 2009 2010 2011 2012 2013 2014 2015 2016 2017 2018 2019 2020 Assoc.: Assist. Full : Assist. Linear (Assoc.: Assist.) Linear (Full : Assist.) The red line is the ratio of a) average salary of all current associate professors at Uconn hired as new assistant professors 7-14 years ago and b) average salary of new assistant professors hired 0 or 1 year ago. The green line is the ratio of a) average salary of all current full professors at Uconn hired as new assistant professors 15-20 years ago and b) above (average new assistants) Source: UConn payroll records NB: The comparison groups of associated and fulls are selected in an effort to include only faculty who are on track (e.g., it explicitly excludes salaries of life-time associates or long-career full professors whose active research may have lapsed)
Comparative average salaries by rank at Maryland Rutgers, Stonybrook, UConn & Umass- Amherst, 2010 and 2020 (2020 dollars) Source: AAUP Faculty Compensation Survey Note: UMass 2020 includes a retroactive base salary increase of 2.5% for FY 21 paid in FY22.
206 Average UConn AAUP real salary vs S&P 500 returns since 2010 salary based on members employed 2010-2020; investments" based on S&P500 both adjusted for CPI (3.5% asumed for 2022 and 2% for 2023 and 2024) 2010=100 for UConn, =70 for S&P (100=pre recession S&P 200 150 Index value 105 105 103 98 100 100 70 50 AAUP faculty avg S&P 500 2021-'23 Administration proposal 2021-'23 AAUP proposal 0 2010 2011 2012 2013 2014 2015 2016 2017 2018 2019 2020 2021