Insights on China and Hong Kong Travel Trends: Recovery Forecast and Destination Comparison
Analyzing the travel data for China and Hong Kong, this report presents insights on overnights in Finland from 2011 to 2022, showcasing fluctuations in visitor numbers and YoY changes. Additionally, it compares top winter and summer markets in 2022 to pre-pandemic levels, highlighting destination preferences and shifts in travel patterns.

Download Presentation

Please find below an Image/Link to download the presentation.
The content on the website is provided AS IS for your information and personal use only. It may not be sold, licensed, or shared on other websites without obtaining consent from the author. Download presentation by click this link. If you encounter any issues during the download, it is possible that the publisher has removed the file from their server.
E N D
Presentation Transcript
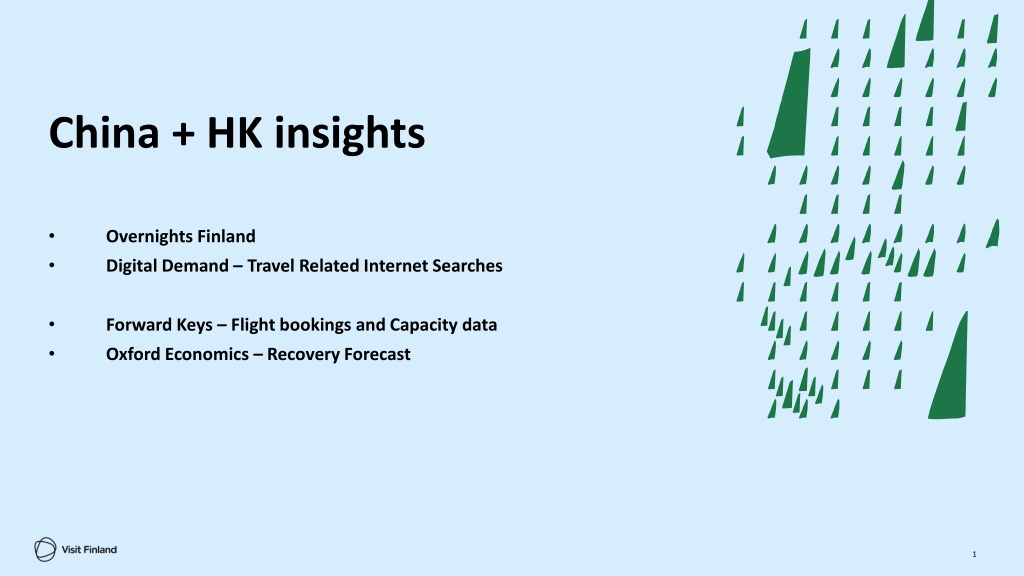
China + HK insights Overnights Finland Digital Demand Travel Related Internet Searches Forward Keys Flight bookings and Capacity data Oxford Economics Recovery Forecast 1
China + HK overnights in Finland 2011-2021 500,000 15% 450,000 6% 400,000 33% 2021 23,000 nights 350,000 300,000 29% YoY change -76% 250,000 2019 441,000 nights 2021 vs. 2019 -95% 40% 200,000 5% 27% 150,000 11% 23% -79% 100,000 50,000 -76% 0 2011 2012 2013 2014 2015 2016 2017 2018 2019 2020 2021 Link to the report: Tilastopalvelu Rudolf - Business Finland 2 Source: Visit Finland Statistics Service Rudolf, Statistics Finland
China + HK overnights in Finland 2022 Despite the low volumes, Helsinki is the biggest greater area for Chinese visitors this year with over 19 000 nights (61% of total share) Link to the report: Tilastopalvelu Rudolf - Business Finland 3 Source: Visit Finland Statistics Service Rudolf, Statistics Finland
Top markets in winter season 2022 And change compared to pre-pandemic High winter season (12-02) Top destinations from China + HK Winter 2022 Dec2021- Feb2022 278 600 180 300 133 100 111 300 55 300 47 400 45 900 45 200 39 600 37 800 30 200 21 500 17 100 16 100 15 900 14 800 Dec2018- Feb2019 Change 2022 vs. 2019 United Kingdom France Germany Netherlands Spain Estonia Belgium Italy United States Switzerland Sweden Poland Denmark Russia Austria China & Hong Kong 334 900 161 700 151 300 106 700 59 400 58 200 30 300 42 900 53 800 51 800 75 100 21 900 21 200 261 300 19 500 139 700 -17 % +11 % -12 % +4 % -7 % -19 % +51 % +5 % -26 % -27 % -60 % -2 % -20 % -94 % -18 % -89 % Helsinki 3 600 Vantaa 3 300 Sotkamo 2 500 Rovaniemi 2 000 Inari (Saariselk ) 1 100 Winter 2019 Helsinki 35 200 Rovaniemi 35 000 Inari (Saariselk ) 16 500 Vantaa 10 000 Sotkamo 9 300 Source: Visit Finland Statistics Service Rudolf, Statistics Finland 4
Top markets in summer season 2022 And change compared to pre-pandemic High summer season (06-08) Top destinations from China + HK Jun-Aug 2022 235 800 229 100 103 800 74 500 68 200 60 400 60 100 54 100 53 800 52 400 45 700 41 800 35 500 34 200 22 400 19 900 Change 2022 vs. 2019 Jun-Aug2019 Summer 2022 Sweden Germany United States United Kingdom Norway Estonia Russia Switzerland France Netherlands Italy Spain Poland Denmark Austria Belgium 255 200 270 300 109 900 90 800 73 400 69 400 243 400 64 400 64 100 62 300 68 200 56 600 31 400 37 700 27 900 21 500 -8 % -15 % -6 % -18 % -7 % -13 % -75 % -16 % -16 % -16 % -33 % -26 % +13 % -9 % -20 % -7 % Helsinki Vantaa Sotkamo Espoo Turku 4 400 1 900 1 100 600 200 Summer 2019 Vantaa 50 900 Helsinki 45 000 Espoo 5 400 Rovaniemi 3 600 Lohja 3 500 China and Hong Kong 133 300 9 800 -93% Source: Visit Finland Statistics Service Rudolf, Statistics Finland 5
China + HK Overnights in Nordics Sources: Visit Finland s Statistics Service Rudolf, Statistics Finland, Statistics Denmark, Statistics Iceland, Statistics Norway and Statistics Sweden Link to the Nordic report: Pohjoismainen vertailu - Business Finland 6
China + HK Overnights in Nordics Sources: Visit Finland s Statistics Service Rudolf, Statistics Finland, Statistics Denmark, Statistics Iceland, Statistics Norway and Statistics Sweden Link to the Nordic report: Pohjoismainen vertailu - Business Finland 7
Digital Demand Travel Related Internet Searches Q1-Q3 2022 8
China: Searches Q1-Q3 2022 Q2/2022 Q3/2022 Q1/2022 9 Source: D2 Digital Demand
China: Seasonality of Searches 2019, 2021 and 2022 10
China: Most searched topics Q1-Q3 2020-2022 Q1/2022 Q2/2022 Q3/2022 11 Source: D2 Digital Demand
ForwardKeys Seat capacity to Finland November/2022 February/2023 12
Direct flights to Finland November 2022 - February 2023 and change in seat capacity compared to pre-pandemic Average weekly frequency From To Asia 72 avg. weekly flights 12 14 Tokyo (HND) HEL (Share; %YoYPP Var) (13%; -46%) 3 14 Doha (DOH)** HEL USA Bangkok (BKK) HEL 11 16 avg. weekly flights Singapore (SIN) HEL 7 (Share; %YoYPP Var) (3%; +16%) Delhi (DEL) HEL 7 Seoul (ICN) HEL 5-6 Hong Kong (HKG) HEL 3 Europe Avg. weekly frequency From To Dubai (DUB) HEL 3 985 avg. weekly flights Mumbai (BOM) HEL 3 (Share; %YoYPP Var) (84%; -21%) New York (JFK) HEL 7 1 5 Phuket (HKT) HEL Dallas (DFW) HEL 3-4 Tokyo (NRT) HEL 2 Los Angeles (LAX) HEL 3 Shanghai (PVG) HEL 2 3 2 Miami (MIA)* HEL Chengdu (CTU) HEL 1 *) MIA starts end-Nov with 3 weekly flights, end-Jan to 2 weekly flights Guangzhou (CAN) HEL 1 **) flight frequency to 14 from mid-Dec Source: Destination Gateway by ForwardKeys Database update 25-Oct
Direct flights from Hong Kong to Finland Nov 2022 - Feb 2023 Comparison with pre-pandemic Seat capacity from Hong Kong to Finland for the coming winter season is clearly decreasing compared to pre-pandemic Finnair is operating mainly three flights a week from Hong Kong during the coming winter season, while it used to operate double daily flights pre-pandemic 14 Source: ForwardKeys Destination Gateway
Direct flights from mainland China to Finland Nov 2022 - Feb 2023 Comparison with pre-pandemic In 2020, China adopted "Five One" policy to curb imported COVID-19 cases, which allowed Chinese carriers to carry out only one outbound flight per week on one route to any country, and foreign airlines to operate just one flight a week into China. Even though the policy has slowly been tweaked and the regulator is now allowing more airlines from China and abroad to resume international flight services, there is only five weekly flights between China and Finland during the coming winter. Finnair is operating 2 weekly flights to/from Shanghai and 1 weekly flight to/from Guangzhou. Juneyao Air has 1 weekly flight to/from Shanghai, and Sichuan Airlines 1 weekly flight to/from Chengdu. 15 Source: ForwardKeys Destination Gateway
Oxford Economics Overnights & Spending Recovery forecasts 16
Overnights Recovery to 2019 levels Databank update October/2022 comp. to 2019 No. of overnights in 2023 Germany 569 000 -14 % Sweden 559 400 0 % UK 491 700 -14 % France 343 700 1 % Netherlands 295 100 13 % USA 225 700 -27 % Italy 190 800 6 % Spain 168 700 -3 % Switzerland 159 800 -4 % China 147 900 -66 % Belgium 117 100 25 % Japan 104 400 -54 % Austria 68 900 -10 % India 62 900 -39 % South Korea 34 200 -39 % Russia will not recover by 2030! 17 Source: Oxford Economics / Tourism Economics Databank
Spending Recovery to 2019 levels Databank update October/2022 Spending (Million US$) in 2023 311,3 276,2 229,3 174,2 134,6 131,1 108,9 96,7 89,1 84,9 66,1 48,9 34,0 29,3 18,5 comp.to 2019 17 % -1 % -5 % 19 % -55 % 26 % -18 % 20 % 9 % 11 % 46 % -48 % 4 % -29 % -29 % Sweden Germany United Kingdom France China Netherlands United States Italy Spain Switzerland Belgium Japan Austria India South Korea Russia will not recover by 2030! 18 Source: Oxford Economics / Tourism Economics Databank