Psoriasis Clinical Audit Findings and Recommendations
This clinical audit on psoriasis evaluated various aspects such as nursing and psychological support, prescription of systemic agents, entry into BADBIR, availability of phototherapy services, and waiting times for PUVA and UVB treatments. The audit involved contributions from both members and non-members, aligning with NICE guidelines. Findings show high percentages of nursing and psychological support availability, prescription of systemic agents, and access to phototherapy services. However, there are discrepancies in waiting times for certain treatments across hospitals.

Download Presentation

Please find below an Image/Link to download the presentation.
The content on the website is provided AS IS for your information and personal use only. It may not be sold, licensed, or shared on other websites without obtaining consent from the author. Download presentation by click this link. If you encounter any issues during the download, it is possible that the publisher has removed the file from their server.
E N D
Presentation Transcript
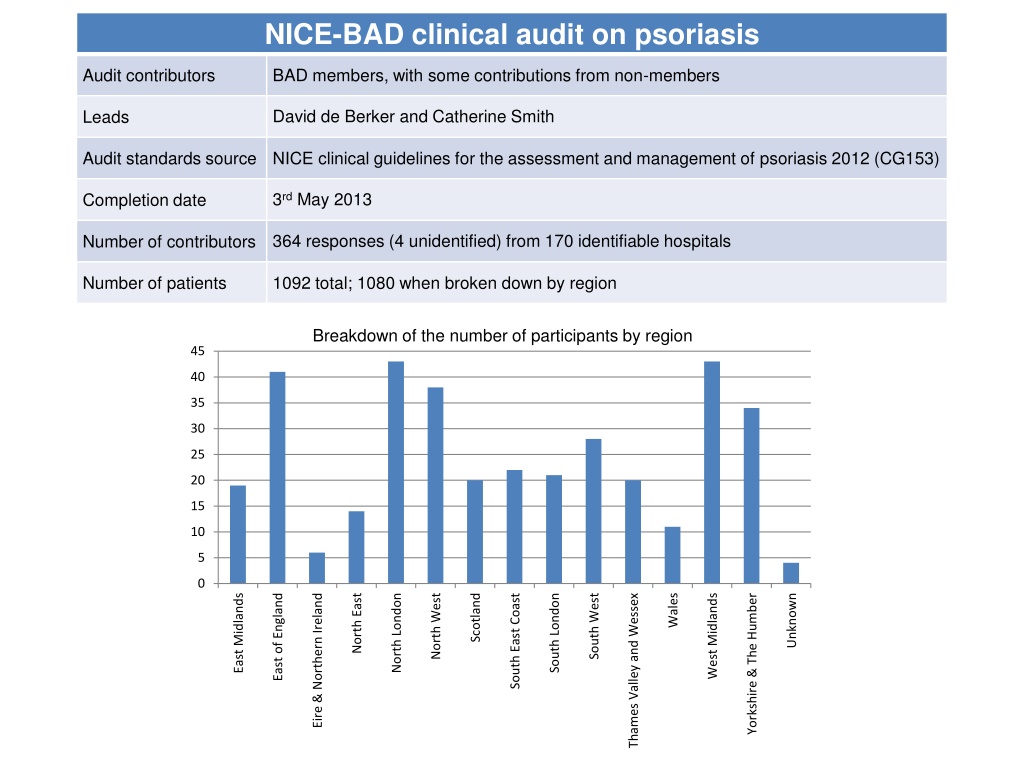
NICE-BAD clinical audit on psoriasis Audit contributors BAD members, with some contributions from non-members David de Berker and Catherine Smith Leads Audit standards source NICE clinical guidelines for the assessment and management of psoriasis 2012 (CG153) 3rd May 2013 Completion date 364 responses (4 unidentified) from 170 identifiable hospitals Number of contributors Number of patients 1092 total; 1080 when broken down by region Breakdown of the number of participants by region 45 40 35 30 25 20 15 10 5 0 North West Wales North East East Midlands West Midlands East of England South West Eire & Northern Ireland North London Scotland South London Thames Valley and Wessex South East Coast Unknown Yorkshire & The Humber
Nursing and psychological support for psoriasis patients 100.0 (n=170) 88.8 90.0 80.0 70.0 2007 audit 60.0 Nursing: 80.2% (n=100) Yes No 50.0 Psychological: 40.0 41% (paed; n=93) 44% (adult; n=88) 30.0 20.0 20.0 10.0 0.0 Nursing support Psychological support Percentage of responses for the availability of nursing and psychological support in 170 participating hospitals.
Prescription of systemic agents and BADBIR entry 99.2 100.0 (n=364) 91.2 90.0 81.6 80.0 70.0 60.0 Yes No Blank 50.0 40.0 30.0 20.0 10.0 0.0 Non-biologic prescription Biologic prescription BADBIR entry Percentage of responses for prescribing systemic agents and entry into BADBIR amongst 364 respondents.
Availability of phototherapy services 100.0 94.7 (n=170) 87.1 90.0 80.0 70.0 60.0 2007 audit Yes No 50.0 PUVA: 90% (n=96) UVB (TL01): 92% (n=97) 40.0 30.0 20.0 10.0 0.0 PUVA UVB Percentage of responses for the availability of PUVA and UVB services in 170 participating hospitals.
Phototherapy services waiting times 45.0 (n=167*) 40.1 40.0 35.0 30.0 26.9 25.0 22.2 PUVA waiting times UVB waiting times 20.0 16.2 15.0 14.4 15.0 12.6 12.0 12.0 10.2 10.0 5.0 0.0 1 2 3 4 >4 Percentage of responses for the average waiting times for PUVA and UVB services in 167* participating hospitals. *Conflicting data for 3 hospitals currently still unresolved
Phototherapy services waiting times 2007 35.0 (n=101) 30.0 25.0 20.0 PUVA waiting times UVB waiting times 15.0 10.0 5.0 0.0 0 1 2 3 4 >4 Percentage of responses for the average waiting times for PUVA and UVB services in 101 participating hospitals.
Physicians Global Assessment 100 Mean percentage per hospital 80 Global results 72/84 0.8% 60 13/18 21.7% 107/123 103/129 53/63 40 101/12979/102 37/57 35/42 20 Yes No Blank 90/114 0 38/60 20/33 41/60 48/66 North London South London Eire & Northern Ireland Thames Valley and Wessex East of England South East Coast Yorkshire & The Humber West Midlands East Midlands Scotland North West South West North East Wales 77.5% (n = 1092) (n = 1080) Boxplots representing the distributional mean percentage of Yes responses to having recorded a PGA for each patient, per hospital in each region.
Psoriasis Area and Severity Index 12/18 60/129 31/60 100 Mean percentage per hospital 80 Global results 0.5% 2.2% 60 40 49/66 52/63 45/84 73/102 Yes No Other Blank 20 37.7% 80/129 0 40/57 62/123 29/42 71/114 31/60 10/33 North London South London Eire & Northern Ireland Thames Valley and Wessex East of England South East Coast Yorkshire & The Humber West Midlands East Midlands Scotland North West South West North East Wales 59.6% (n = 1092) (n = 1080) Boxplots representing the distributional mean percentage of Yes responses to having recorded a PASI scoring for each patient, per hospital in each region.
Dermatology Life Quality Index 12/18 58/129 25/60 82/129 100 Mean percentage per hospital 80 Global results 0.5% 50/66 60 40 51/63 20 42.4% Yes No Blank 63/102 28/60 0 37/57 64/123 28/42 66/114 41/84 12/33 North London South London Eire & Northern Ireland Thames Valley and Wessex East of England South East Coast Yorkshire & The Humber West Midlands East Midlands Scotland North West South West North East Wales 57.1% (n = 1092) (n = 1080) Boxplots representing the distributional mean percentage of Yes responses to having recorded a DLQI scoring for each patient, per hospital in each region.
Psoriasis Epidemiological Screening Tool 6/18 100 80 Global results Mean percentage per hospital 13/60 2.0% 6.0% 60 9/129 32.2% 7/114 40 7/129 5/84 6/102 3/33 2/66 1/57 Yes No N/A Blank 20 1/42 2/123 1/63 0/60 0 North London South London Eire & Northern Ireland Thames Valley and Wessex East of England South East Coast Yorkshire & The Humber West Midlands East Midlands Scotland North West South West North East Wales 59.8% (n = 1092) (n = 1080) Boxplots representing the distributional mean percentage of Yes responses to having recorded a PEST scoring for each patient, per hospital in each region.
Psoriasis Epidemiological Screening Tool 8/96 7/60 13/46 7/81 6/13 100 Mean percentage per hospital 80 60 1/28 3/19 6/66 40 2/34 5/43 20 1/30 2/72 1/49 0/28 0 North London South London Eire & Northern Ireland Thames Valley and Wessex East of England South East Coast Yorkshire & The Humber West Midlands East Midlands Scotland North West South West North East Wales (n = 667) Boxplots representing the distributional mean percentage of Yes responses to having recorded a PEST scoring for each of the 667 patients from identifiable hospitals who has been assessed for psoriatic arthritis, per hospital, in each region.
Involvement of nails, high-impact and difficult-to-treat sites 10/18 95/129 44/60 100 80 Global results 0.5% Mean percentage per hospital 79/102 60 37/42 44/63 28.6% 40 51/66 19/33 89/114 20 Yes No Blank 0 100/129 35/57 70/123 53/84 38/60 North London South London Eire & Northern Ireland Thames Valley and Wessex East of England South East Coast Yorkshire & The Humber West Midlands East Midlands Scotland North West South West North East Wales 70.9% (n = 1092) (n = 1080) Boxplots representing the distributional mean percentage of Yes responses to having recorded involvement of nails, high-impact and difficult-to-treat sites in assessing disease severity for each patient, per hospital in each region.
Systemic upset 33/114 21/66 6/33 100 Mean percentage per hospital 80 Global results 5/18 42/129 0.3% 60 24.4% 9/57 13/84 40 4/60 6/42 15/123 Yes No N/A Blank 20 52.0% 0 21/60 24/63 39/102 28/129 North London South London Eire & Northern Ireland Thames Valley and Wessex East of England South East Coast Yorkshire & The Humber West Midlands East Midlands Scotland North West South West North East Wales 23.4% (n = 1092) (n = 1080) Boxplots representing the distributional mean percentage of Yes responses to having recorded any systemic upset in assessing disease severity for each patient, per hospital in each region.
Assessment for psoriatic arthritis 13/18 28/60 81/129 100 Mean percentage per hospital 30/42 80 Global results 0.5% 60 40 46/60 49/63 74/123 37.8% 20 Yes No Blank 96/129 0 43/84 28/57 60/114 34/66 66/102 19/33 North London South London Eire & Northern Ireland Thames Valley and Wessex East of England South East Coast Yorkshire & The Humber West Midlands East Midlands Scotland North West South West North East Wales 61.7% (n = 1092) (n = 1080) Boxplots representing the distributional mean percentage of Yes responses to having recorded assessment for psoriatic arthritis for each patient, per hospital in each region.