Understanding the Behavior of Gases: A Comparison of Real and Ideal Gases
This chapter delves into the behavior of gases, contrasting real gases with the ideal gas model. It explores the P-V-T relationships of gases, highlighting the differences between ideal and real gas behaviors based on molecular properties. The critical point where coexisting gas and liquid phases coincide is discussed, offering insights into the compressibility and equilibrium of different phases at varying temperatures.

Download Presentation

Please find below an Image/Link to download the presentation.
The content on the website is provided AS IS for your information and personal use only. It may not be sold, licensed, or shared on other websites without obtaining consent from the author. Download presentation by click this link. If you encounter any issues during the download, it is possible that the publisher has removed the file from their server.
E N D
Presentation Transcript
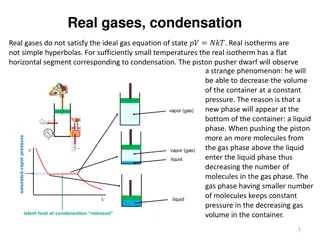
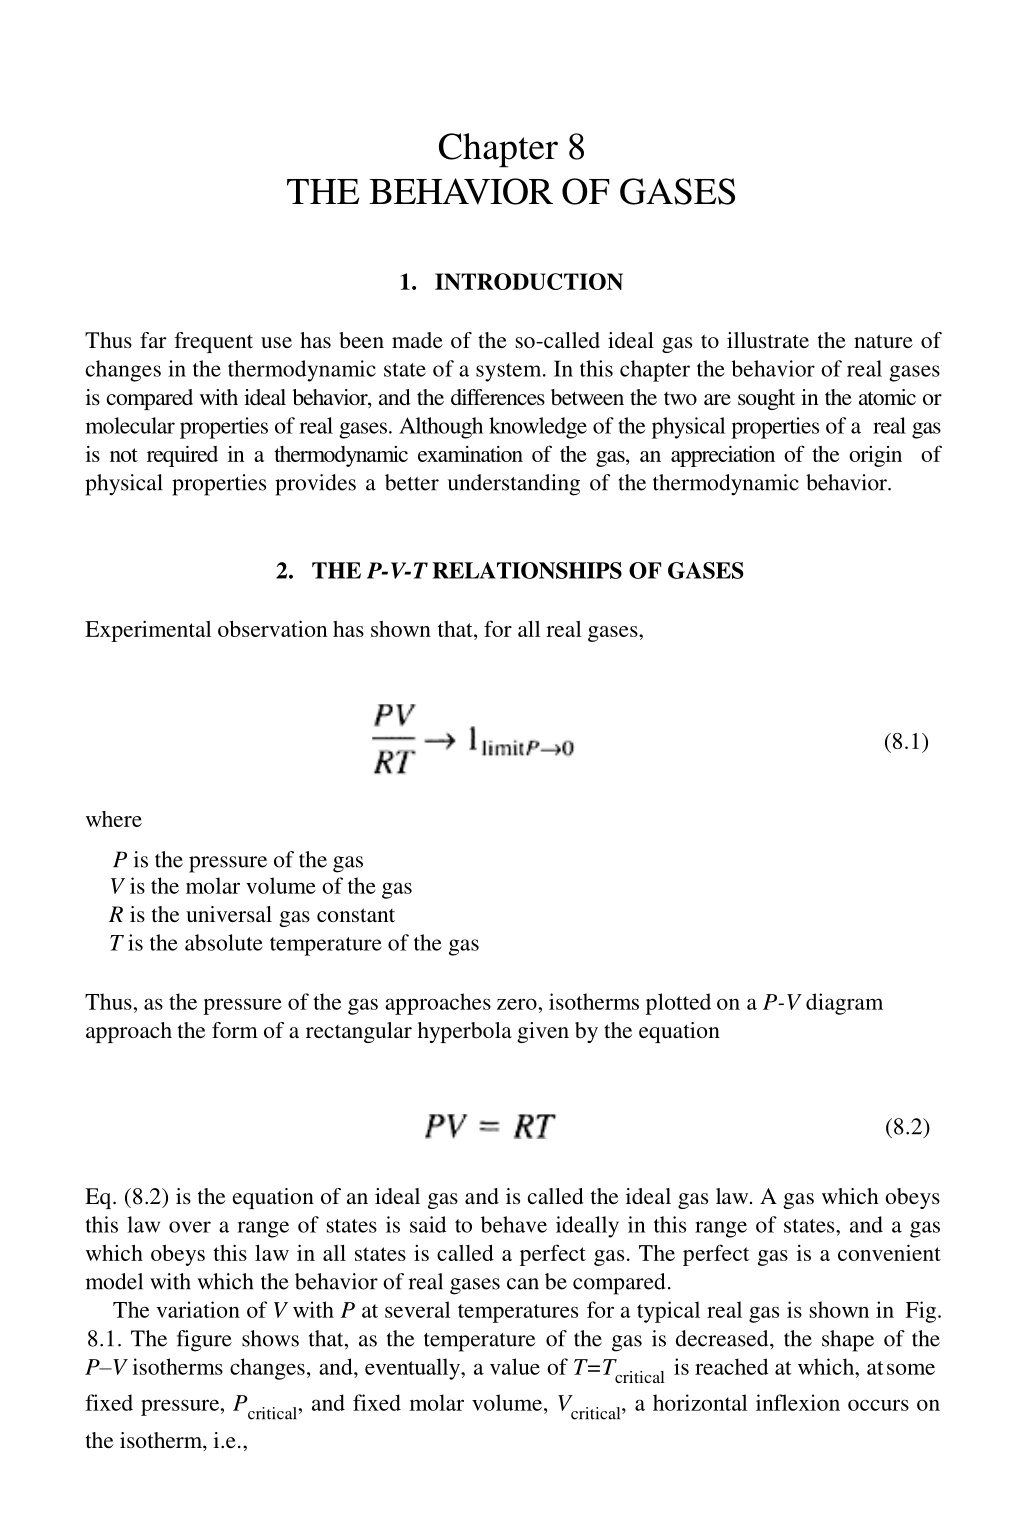
Chapter 8 THE BEHAVIOR OF GASES 1. INTRODUCTION Thus far frequent use has been made of the so-called ideal gas to illustrate the nature of changes in the thermodynamic state of a system. In this chapter the behavior of real gases is compared with ideal behavior, and the differences between the two are sought in the atomic or molecular properties of real gases. Although knowledge of the physical properties of a real gas is not required in a thermodynamic examination of the gas, an appreciation of the origin of physical properties provides a better understanding of the thermodynamic behavior. 2. THE P-V-T RELATIONSHIPS OF GASES Experimental observation has shown that, for all real gases, (8.1) where P is the pressure of the gas V is the molar volume of the gas R is the universal gas constant T is the absolute temperature of the gas Thus, as the pressure of the gas approaches zero, isotherms plotted on a P-V diagram approach the form of a rectangular hyperbola given by the equation (8.2) Eq. (8.2) is the equation of an ideal gas and is called the ideal gas law. A gas which obeys this law over a range of states is said to behave ideally in this range of states, and a gas which obeys this law in all states is called a perfect gas. The perfect gas is a convenient model with which the behavior of real gases can be compared. The variation of V with P at several temperatures for a typical real gas is shown in Fig. 8.1. The figure shows that, as the temperature of the gas is decreased, the shape of the P V isotherms changes, and, eventually, a value of T=Tcriticalis reached at which, atsome fixed pressure, Pcritical, and fixed molar volume, Vcritical, a horizontal inflexion occurs on the isotherm, i.e.,
206 Introduction to the Thermodynamics ofMaterials At temperatures less than Tcr two phases can exist. For example, if 1 mole of vapor, initially in the stated (in Fig. 8.1), is isothermally compressed at T8, the state of the vapor moves along the isotherm toward the state B. At B the pressure of the vapor is the saturated vapor pressure of the liquid at T8, and further decrease in the volume of Figure 8.1 P V isotherms for a typical real gas. the system causes condensation of the vapor and consequent appearance of the liquid phase. The liquid phase, which is in equilibrium with the vapor, appears at the state C, and VCis the molar volume of the liquid at PCand T8. Further decrease in the volume of the system causes further condensation, during which the states of the liquid and vapor phases remain fixed at C and B, respectively, and the total volume of the system, which is determined by the relative proportions of the liquid and vapor phases, moves along the horizontal line from B to C. Eventually condensation is complete, and the system existsalong the isotherm toward the state D. The large value of (6P/6V)Tin the range of liquid states and the small value of (6P/6V)Tin the range of vapor states indicate the low compressibility of the liquid phase and the high compressibility of the vapor phase. as 100% liquid in the state C. Further increase in pressure moves the state of the system along the isotherm toward the state D. The large value of (6P/ 6V)Tin the range of liquid states and the small value of (6P/ 6V)Tin the range of vapor states indicate the low compressibility of the liquid phase and the high compressibility of the vaporphase.
207 The Behavior of Gases Fig. 8.1 also shows that, as the temperature is increased up to Tcr, the molar volume of the liquid in equilibrium with the vapor (corresponding to the point C) progressively in- creases and the molar volume of the vapor in equilibrium with the liquid (corresponding to the point B) progressively decreases. Thus, as the temperature is increased toward Tcr, the vapor in equilibrium with liquid becomes more dense, and the liquid in equilibrium with the vapor becomes less dense. Eventually, when Tcris reached, the molar volumes of the coexisting phases coincide at the state Pcr, Tcr. The critical point is thus the meeting point of the locus of the point C with temperature (the line mn) and the locus of the point B with temperature (the line on), and the complete locus line mno defines the field of vapor-liquid equilibrium. At temperatures higher than Tcrdistinct two-phase equilibrium (involving two phases separated by a boundary across which the properties of the system change abruptly) does not occur and thus the gaseous state cannot be liquified by isothermal compression at temperatures higher than Tcr. As the vapor can be condensed by isothermal compression at temperatures lower than Tcr, the critical isotherm provides a distinction between the gaseous and vapor states and defines the gaseous state phase field. The phase fields are shown in Fig. 8.2. Liquefaction of a gas requires that the gas be cooled. Consider the process path 1 2 in Fig. 8.2. According to this path, which represents the cooling of the gas at constant pressure, the phase change gas liquid occurs at the point a, at which the temperature falls below Tcr. In fact, at temperatures greater than Tcrthe criticaltemperature isotherm has no physical significance. In passing from the state 1 to the state 2 the molar volume of the system progressively decreases, and, hence, the density of the system progressively increases. No phase separation occurs between the states 1 and 2, and the system in the state 2 can equivalently be regarded as being a liquid of normal density or a gas of high density and, in state 1, can be regarded as being a gas of normal density or a liquid of low density. Physically, no distinction can be made between the liquid and gaseous states at pressures greater than Pcr, and consequently the system existing in these states is called a supercritical fluid. Thus, in the P T phase diagram for the system (e.g., Fig. 7.10) the liquid-vapor equilibrium line (OB in Fig. 7.10) terminates at the critical point Pcr, Tcr.
208 Introduction to the Thermodynamics ofMaterials Figure 8.2 The fields of phase stability of a typical real gas. 8.3 DEVIATION FROM IDEALITY AND EQUATIONS OF STATE FOR REALGASES The deviation of a real gas from ideal behavior can be measured as the deviation of the compressibility factor from unity. The compressibility factor, Z, is defined as (8.3) which has the value of 1 for a perfect gas in all states of existence. Z itself is a function of the state of the system and, thus, is dependent on any two chosen dependent variables, e.g., Z=Z(P,T). Fig. 8.3 shows the variation of Z with P at constant temperature for several gases. For all of the gases in Fig. 8.3 the Z is a linear function of P up to about 10 atm and, hence, can be expressed as or
The Behavior of Gases 209 which can be written as or (8.4) where b =mRT and has the dimensions of volume. Eq. (8.4) serves as the equation of state for the gases up to the pressures at which deviation from linear dependence of Z on P begins. Comparison with Eq. (8.4) shows that the deviations from ideal behavior, in the initial range of pressure, can be dealt with by making a correction to the volume term in the equation of state for an ideal gas. The need for such a correction is reasonable in view of the fact that an ideal gas is a system of noninteracting, volumeless particles, whereas the particles of real gases have small, but nevertheless finite, volumes. Thus, in a real gas, the volume available to the movement of Avogadro s number of particles is less than the molar volume of the gas by an amount equal to the volume excluded by the particles themselves, and the ideal gas equation should be corrected for this effect. At first sight it might appear that the constant b in Eq. (8.4) is the volume excluded by the particles, but inspection of Fig. 8.3 shows that, with the exception of hydrogen, b is a negative quantity. Thus the above interpretation of b is incorrect, and Eq. (8.4) is a purely empirical equation which can be made to describe the behavior of real gases over a narrow range of low pressures in the vicinity of 0 C. Figure 8.3 The variations, with pressure, of the compressibility factors of several gases at0 C.
210 Introduction to the Thermodynamics ofMaterials Figure 8.4 The variations of the compressibility factors of several gases with reduced pressure at several reduced temperatures. If Fig. 8.3 is replotted as Z versus the reduced pressure, PR(where PR=P/Pcr) for fixed values of the reduced temperature, TR(=T/Tcr), it is found that all gases lie on a single line. Fig. 8.4 shows a series of such plots. The behavior shown in Fig. 8.4 gives rise to the law of corresponding states, which states that all gases obey the same equation of state when expressed in terms of the reduced variables PR, TR, and VRinstead of P, T, and V. the values of two reduced variables are identical for two gases then the gases have approximately equal values of the third reduced variable and are then said to be in corresponding states. Fig. 8.4 shows that the compressibility factor is the same function of the reduced variables for all gases (see Prob.8.1). 8.4 THE VAN DER WAALS GAS An ideal gas obeys the ideal gas law and has an internal energy, U, which is a function only of temperature. Consequently, an ideal gas is an assemblage of volumeless noninteracting particles, the energy of which is entirely the translational energy of motion of the constituent particles. Attempts to derive equations of state for real gases have attempted to modify the ideal gas equation by taking into consideration the facts that
The Behavior of Gases 211 1. The particles of a real gas occupy a finite volume and 2. The particles of a real gas are surrounded by force fields which cause them to interact with one another. The magnitude of the importance of these two considerations depends on the state of the gas. For example, if the molar volume of the gas is large, then the volume fraction occupied by the particles themselves is small, and the magnitude of this effect on the behavior of the gas will be correspondingly small. Similarly, as the increases, the average distance between the particle increases, and thus the effect of interactions between particles on the behavior of the gas decreases. For a fixed number of moles of gas, an increase in the molar volume corresponds to a decrease in the density, n/V , and such states of existence occur at low pressure and high temperature, as can be seen from the ideal gas equation, i.e., molar volume Thus, approach toward ideal behavior is to be expected as the pressure is decreased and the temperature is increased. The most celebrated equation of state for nonideal gases, which was derived from considerations 1 and 2 above, is the van der Waals equation, which, for 1 mole of gas, is written as where P is the measured pressure of the gas, a/V2is a correction term for the interactions which occur among the particles of the gas, V is the measured volume of the gas, and b is a correction term for the finite volume of the particles.* The term b is determined by considering a collision between two spherical particles. Two particles, of radius r, collide when the distance between their centers decreases to a value less than 2r, and, as is shown in Fig. 8.5a, at the point of collision the particles exclude a volume of to all other particles. The volume excluded per particles is thus where *For n moles of van der Waals gas, the equation of state is V=nV.
212 Introduction to the Thermodynamics ofMaterials Figure 8.5 (a) Illustration of the volume excluded when two spheri- cal atomscollide. Figure 8.5 (b) The interactions among atoms in a gas phase. The volume excluded is thus four times the volume of all of the particles present and has the value b. Thus in 1 mole of gas, the volume (V b) is that available for motion of the particles of the gas and is the molar volume which the gas would have were the gas ideal, i.e., if the particles were volumeless. The long-range attractive forces operating between the gas particles decrease the pressure exerted on the containing wall to a value less than that which would be exerted in the absence of the forces, van der Waals considered the following: The particles in the layer adjacent to the containing wall experience a net inward pull due to interaction with the particles in the next adjacent layer. These
The Behavior of Gases 213 attractive forces give rise to the phenomenon of internal pressure, and the magnitude of the net inward pull (i.e., the decrease in the pressure exerted by the gas on the containing wall) is proportional to the number of particles in the surface layer and to the number of particles in the next-to-the-surface layer. Both of these quantities are proportional to the density of the gas, n/V, and hence the net inward pull is proportional to the square of the density of the gas, or, for 1 mole of gas, equal to a/V2, where a is a constant. Thus, if P is the measured pressure of the gas, P+a/V2is the pressure which the gas would exert on the containing wall if the gas were ideal, i.e., in the absence of interactions among the particles. The effect is illustrated in Fig. 8.5b. The van der Waals equation can be written as which, being cubic in V, has three roots. Plotting V as a function of P for different values of T gives the family of isotherms shown in Fig. 8.6. As the temperature is increased the minimum and the maximum approach one another until, at Tcr, they coincide andproduce a horizontal inflexion on the P-V curve. At this, the critical, point T=Tcr, P=Pcr, and V=Vcr, and the van der Waals equation gives Solving these equationsgives (8.5) and hence the constants a and b for any gas can be evaluated from knowledge of the values of Tcrand Pcr. Alternatively, the values of a and b can be obtained by fitting the van der Waals equation to experimentally measured variations of V with T and P for real gases. The critical states, van der Waal constants, and values of Z at the critical point for several gases are listed in Table 8.1.
214 Introduction to the Thermodynamics ofMaterials Figure 8.6 The isothermal variation of V with P for a van der Waals gas at severaltemperatures. Table 8.1 The critical states, van der Waals constants, and values of Z at the critical points for several gases T ,K cr P ,atm cr Z V ,cm3/mole cr Gas b,liters/mole cr He 5.3 2.26 57.6 0.0341 0.0237 0.299 H2 33.3 12.8 65.0 0.2461 0.0267 0.304 N2 126.1 33.5 90.0 1.39 0.0391 0.292 CO 134.0 35.0 90.0 1.49 0.0399 0.295 O2 153.4 49.7 74.4 1.36 0.0318 0.293 CO2 304.2 73.0 95.7 3.59 0.0427 0.280 NH3 405.6 111.5 72.4 4.17 0.0371 0.243 H2O 647.2 217.7 45.0 5.46 0.0305 0.184 Consider the isothermal variation of V with P given by the van der Waals equation and shown in Fig. 8.7. Any increase in the pressure exerted on a system causes a decrease in the volume of the system, (6P/6V)T<0. This is a condition of intrinsic stability and, in Fig. 8.7, this condition is violated over the portion JHF, which means that this portion of the curve has no physical significance. The effect of pressure on the equilibrium state of the
The Behavior of Gases 215 system can be obtained from a consideration of the variation of the Gibbs free energy with P along the isotherm. Eq. (5.12) gives the varia-tion of G with P at constant T as dG=VdP, and integration of this equation between the state (P,T) and (PA,T) gives Figure 8.7 The isothermal variation, with pressure, of the volume of a van der Waals gas at a temperature below the critical temperature. or If an arbitrary value is assigned to GA, then graphical integration of the integral f rom Fig. 8.7 allows the variation of G with P, corresponding to the variation of V with P in Fig. 8.7, to be drawn. The values of the integrals are listed in Table 8.2, and the variation of G with P is shown in Fig. 8.8.
216 Introduction to the Thermodynamics ofMaterials Fig. 8.8 shows that, as the pressure is increased from1P , the value of G increases. At pressures greater than P2three states of existence become available to the system; for example, at P3the three states are given by the points I, K, and C. The stable, or equilibrium, state is that with the lowest Gibbs free energy, and hence over the range of pressure from P2to P4the stable states lie on the line BCD. As the pressure is increased above P4the state with the lowest Gibbs free energy no longer lies on the original line (the continuation of the line BCD) but lies on the line LMN. The change of stability at P4 corresponds to a change of phase at this point, i.e., at pressures less than P4one phase is stable, and at pressures greater than P4another phase is stable. At low pressures (P<P4), the system exists as a vapor, and at high pressures (P>P4), it exists as a liquid. At P4GD, which is the molar Gibbs free energy of the vapor phase, equals GL, which is the molar Gibbs free energy of the liquid phase, and thus vapor and liquid coexist in equilibrium with one another at the state P4,T. In Fig. 8.7 a tie-line connects the points D and L across a two-phase region. In Fig. 8.8 the lines DF and LJ represent, respectively, the metastable Table 8.2 Graphical integration of Fig. 8.7 =GA+arealAB2 =GA+arealAC3 GC =GA+arealAD4 GD =GA+arealAE5 GE =GA+arealAF6 GF =GA+arealAE5 +area EFG GG =GA+arealAD4 +area DFH GH =GA+arealAC3 +area CFI GI =GA+arealAB2 +area BFJ GJ =GA+arealAC3 +area CFI area IJK GK =GA+arealAD4 +area DFH area HJL GL =GA+arealAEF +area EFG area GJM GM =GA+arealAF6 area FJN GN =GA+arealAF6 area FJN+area 6NO7 Go
The Behavior of Gases 217 Figure 8.8 Schematic representation of the variation, with pressure, of the molar Gibbs free energy of a van der Waals gas at a constant temperature lower than the criticaltemperature. vapor and metastable liquid states. Thus, in the absence of nucleation of the liquid phase from the vapor phase at the state D, supersaturated vapor would exist along the line DEF, and, in the absence of nucleation of the vapor phase from the liquid phase at the state L, supersaturated liquid would exist along the line LKJ. In view of the violation of the criterion for intrinsic stability over the states path JHF, the states represented by this line in both Fig. 8.7 and Fig. 8.8 have no physical significance. It is thus seen that the van der Waals equation predicts the phase change which occurs in the system at temperatures less than Tcr. At any temperature below Tcr, the value of P for equilibrium between the vapor and liquid phases, e.g., P4 in Figs. 8.7 and 8.8, is that which the area HFD equals the area LJH in Fig. 8.7. The measured values of Tcr and Pcr for carbon dioxide are, respectively, 31 C and 72.9 atm. Thus, from Eq. (8.5), and in which case the van der Waals equation for CO2 is given as
218 Introduction to the Thermodynamics ofMaterials The variation of P with V, given by this equation, is shown at several temperatures in Fig. 8.9, in which it is seen that the 304 K isotherm exhibits a horizontal inflexion at Figure 8.9 P V isotherms for van der Waals carbon dioxide. the critical point. At temperatures lower than 304 K the isotherms show the expected maxima and minima. The variation, with temperature, of the saturated vapor pressure of van der Waals liquid CO2can be determined by finding the tie-line on each isotherm which gives equal areas DFH and LJH as explained with reference to Fig. 8.7. Alternatively, the variation of the molar Gibbs free energy with pressure can be determined along each isotherm by graphical integration of the variation of V with P. These relationships are shown for several temperatures in Fig. 8.10, which shows the variation of the saturated vapor pressure of liquid CO2(the points P) with temperature. Fig. 8.10 also shows that, as the temperature increases toward the critical point, the range of nonphysical states (J to F in Fig. 8.8) diminishes and finally disappears at Tcr. At temperatures higher than Tcrthe full-line indicates that one phase alone is stable over the entire range of pressure. As GAin Eq. (8.6) is a function of temperature, the positions of the isothermsinFig.8.10 withrespecttooneanotherar e arbitrary; onlythe P-axisisquantitatively significant.
The Behavior of Gases 219 The variation of the saturated vapor pressure of liquid CO2with temperature, obtained from the van der Waals equation and plotted as the logarithm of P vs. the reciprocal of the absolute temperature, is shown in Fig. 8.11. Fig. 8.11 also shows the variation of the measured saturated vapor pressure with temperature. Comparison shows that the van der Waals equation predicts values of vapor pressure which are higher than the measured Figure 8.10 The variations of G with P for van der Waals carbon dioxide at severaltemperatures. Figure 8.11 Comparison of the variation, with temperature, of the vapor pressure of van der Waals liquid carbon dioxide with the measured vapor pressures.
220 Introduction to the Thermodynamics ofMaterials values, although the difference between the two values decreases with increasing temperature. Consequently, the van der Waals equation predicts a value of the molar latent heat of evaporation of liquid CO2which is less than the measured value, with OHevapbeing obtained as 2.303 R (the slope of the line) in Fig.8.11. The molar latent heat of evaporation of a liquified van der Waals gas can be calculated as follows: where Vvand Vlare, respectively, the molar volumes of the coexisting vapor and liquid phases, and P is the saturated vapor pressure, at the temperature T. From Eqs. (3.12) and (5.33), which, applied to the van der Waals gas, gives Integration gives in which the integration constant is a function of temperature.Thus (8.6) (8.7)
The Behavior of Gases 221 Eq. (8.7) thus correctly predicts that OHevap for a van der Waals gas rapidly falls to zero as the temperature approaches Tcr, in which state Vv=Vl. Although van der Waals developed his equation from a consideration of the physical factors causing nonideal behavior, the requirement that the pressure, volume, and temperature at the critical point be known for calculation of a and b means that the equation is empirical. This, however, does not detract from the usefulness of the equation in representing the behavior of a gas which exhibits a relatively small departure from ideality. 8.5 OTHER EQUATIONS OF STATE FOR NONIDEALGASES Other examples of derived equations of state for nonideal gases are the Dieterici equation and the Berthelotequation Neither of these equations has a fundamental basis, and general empirical equations are normally used. Examples of such equations are the Beattie-Bridgeman equation, which contains five constants in addition to R and fits the P-V-T relationships over wide ranges of temperature and pressure, and the Kammerlingh-Onnes, or virial, equation of state. In the latter equation it is assumed that PV/RT is a power series of P or 1/V,i.e., or
222 Introduction to the Thermodynamics ofMaterials The product PV is called the virial, B or B is called the first virial coefficient, C or C is called the second virial coefficient, etc., and the virial coefficients are functions temperature. In both equations, as pressure approaches zero and volume approaches infinity, PV/RT l. The virial equation converges rapidly in the gas phase, and thus the equation of state can be represented by the virial expansion over the entire range of densities and pressures. In practice, however, the virial equation is used only when the first few terms need to be retained. At low pressures or densities, of or both of which are expressions of Eq. (8.4). 8.6 THE THERMODYNAMIC PROPERTIES OF IDEAL GASESAND MIXTURES OF IDEALGASES The variation of the molar Gibbs free energy of a closed system of fixed composition, with pressure at constant temperature, is given by the fundamental equation, Eq. (5.25) as For 1 mole of an ideal gas, this can be written as (8.8)
The Behavior of Gases 223 and thus, for an isothermal change of pressure from P1to P2at T, (8.9) As Gibbs free energies do not have absolute values (only changes in G can be measured), it is convenient to choose an arbitrary reference state from which the changes in Gibbs free energy can be measured. This reference state is called the standard state and is chosen as being the state of 1 mole of pure gas at 1 atm pressure and the temperature of interest. The Gibbs free energy of 1 mole of gas in the standard state G(P=1, T) is designated G (T) and thus, from Eq. (8.9), the Gibbs free energy of 1 mole of gas at any other pressure P is given as orsimply (8.10) In Eq. (8.10) notice that the logarithm of a dimensionless ratio, P/l, occurs in the right- hand term. Mixtures of Ideal Gases Before discussing the thermodynamic properties of mixtures of ideal gases, it is necessary to introduce the concepts of mole fraction, partial pressure, and partial molar quantities. Mole fraction. When a system contains more than one component, i.e., when the composition of the system is variable, it is necessary to invent a means of expressing the composition. Several composition variables are in use, of which only one the mole fraction has any theoretical significance. The mole fraction, Xi, of the component i is defined as the ratio of the number of moles of i in the system to the total number of moles of all of the components in the system. For example, if the system contains nAmoles of A, nBmoles of B, and nCmoles of C, then
224 Introduction to the Thermodynamics ofMaterials and The convenience of the use of mole fraction as a composition variable lies in the fact that the sum of the mole fractions of all of the components in a system is unity. For example, in the above system XA+XB+XC=1. Dalton s law of partial pressures. The pressure P exerted by a mixture of ideal gases is equal to the sum of the pressures exerted by each of the individual component gases, and the contribution made to the total pressure, P, by each individual gas is called the partial pressure of that gas. The partial pressure exerted by a component gas, pi, is thus the pressure that it would exert if it alone were present. In a mixture of the ideal gases A, B, and C, Consider a fixed volume V , at the temperature T, which contains nA moles of an ideal gas A. The pressure exerted is thus (8.11) If, to this constant volume containing nA moles of gas A, nB moles of ideal gas B are added, the pressure increases to (8.12) Division of Eq. (8.11) by Eq. (8.12)gives
The Behavior of Gases 225 which, for the gas A in the mixture, can be written as or (8.13) Thus, in a mixture of ideal gases, the partial pressure of a component gas is the product of its mole fraction and the total pressure of the gas mixture. Eq. (8.13) is called Dalton's law of partial pressures. Partial molar quantities. The molar value of any extensive state property of a component of a mixture is called the partial molar value of the property. This value is not necessarily equal to the value of the molar property of the pure component. The partial molar value of an extensive property Q of the component i in a mixture of components i, j, k, is formally defined as (8.14) where Q is the value of the extensive property for an arbitrary quantity of the mixture. is thus the rate of change of the value of Q with ni at constant temperature, pressure, and composition of the mixture, and, being a state property, is a function of temperature, pressure, and composition. The definitionof can also be made as follows. If 1 mole of i is added, at constant temperature and pressure, to a quantity of mixture which is sufficiently large that the addition causes virtually no change in the composition of the mixture, the consequent increase in the value of Q equals the value of in the mixture. In the case of the extensive property being the Gibbs free energy, and, from Eq. (5.16), it is seen that
226 Introduction to the Thermodynamics ofMaterials i.e., the partial molar Gibbs free energy of a component in a mixture equals the chemical potential of the component in the mixture. The relationships among the various state functions developed in the preceding chapters are applicable to the partial molar properties of the components of a system. For example, the fundamental equation, Eq. (5.25), at constant T and compositiongives where G is the Gibbs free energy of the system and V is the volume of the system. For a variation in ni, the number of moles of component i in the system, at constant T, P, andnj, But, bydefinition and, as G is a state function, in which lose the order of partial differentiation has no influence on the result Hence which is simply the application of Eq. (5.25) to the component i in the system. Thus, for the ideal gas A in a mixture of idealgases,
The Behavior of Gases 227 The partial molarvolume, , in a gas mixtureis Differentiation of Eq. (8.13) at constant T and composition gives dpA=XAdP, and hence Integration between the limits pA=pA and pA=1 gives (8.15) Eq. (8.15) could also have been obtained by integrating Eq. (8.8) from the standard state pA=PA=1, XA=1, T to the state pA, XA, T. The Heat of Mixing of Ideal Gases For each component gas in a mixture of ideal gases where P is the total pressure of the gas mixture at the temperature T. Dividing by T and differentiating with respect to T at constant pressure and composition gives But, from Eq.(5.37) (8.17)
228 Introduction to the Thermodynamics ofMaterials and thus (8.18) i.e., the partial molar enthalpy of ideal gas i in a mixture of ideal gases equals the molar enthalpy of pure i, and thus the enthalpy of the gas mixture equals the sum of the enthalpies of the component gases before mixing, i.e., (8.19) where OH mixis the change in the enthalpy caused by the process ofmixing. As is, by definition, a function only of temperature, then, from Eqs. (8.16) and (8.17) it is seen that is a function only of temperature. Thus, in addition to being independent of composition, is independent of pressure. The zero heat of mixing of ideal gases is a consequence of the fact that the particles of an ideal gas do not interact with one another. The Gibbs Free Energy of Mixing of Ideal Gases For each component gas i in a mixture of ideal gases, and for each component gas beforemixing where pi is the partial pressure of i in the gas mixture and Pi is the pressure of the pure gas i before mixing. The mixing process, being a change of state, can be written as unmixed components (state 1) mixed components (state2)
The Behavior of Gases 229 and (8.20) The value of OG mixdepends, thus, on the value of p and p for each gas. If, before i i mixing, the gases are all at the same pressure, i.e., if Pi=Pj=Pk= and mixing is carried out at total constant volume such that the total pressure of the mixture, Pmix, equals the initial pressures of the gases before mixing, then, as pi/pi=Xi, (8.21) As the values of X are less than unity, OG mixis a negative quantity, which corresponds i with the fact that the mixing of gases is a spontaneous process. The Entropy of Mixing of Ideal Gases As OH mix=0 and then (8.22) or, if Pi=Pj=Pk= =Pthen (8.23) which is seen to be positive, in accord with the fact that the mixing of gases is a spontaneous process.
230 Introduction to the Thermodynamics ofMaterials 8.7 THE THERMODYNAMIC TREATMENT OF NONIDEALGASES Eq. (8.10) showed that, at any temperature, the molar Gibbs free energy of an ideal gas is a linear function of the logarithm of the pressure of the gas. This property arises from the ideal gas law which was used in the derivation of Eq. (8.10), and thus, if the gas is not ideal, then the relationship between the logarithm of the pressure of the gas and its molar Gibbs free energy is not linear. However, in view of the simple form of Eq. (8.10), a function is invented which, when used in place of pressure in Eq. (8.10), gives a linear relationship between the molar Gibbs free energy of an nonideal gas and the logarithm of the function. This function is called the fugacity,f, and is partially defined by the equation The integration constant is chosen such that the fugacity approaches the pressure as the pressure approaches zero, i.e., in which case (8.24) where G is the molar Gibbs free energy of the gas in its standard state, which is now defined as that state in which f=1 at the temperature T. (The standard state for an ideal gas was defined as being P=1,T.) Consider a gas which obeys the equation of state where a is a function only of temperature and is a measure of the deviation of the gas from ideality. Eq. (5.12) gives dG=VdP at constant T, and Eq. (8.24) gives dG=RTd ln f at constant T. Thus, at constant T,
The Behavior of Gases 231 andhence (8.25) Integration between the states P=P and P=0, at constant Tgives (8.26) As f/P=1 when P=0, then In (f/P)=0 when P=0, and hence In order that a can be taken as being independent of pressure, the deviation of the gas from ideality must be small, in which case a is asmall number. Thus, andhence If the gas behaved ideally, then the ideal pressure, Pid, would be given as RT/V.Thus which shows that the actual pressure of the gas is the geometric mean of its fugacity and the pressure which it would exert if it behaved ideally. It is also seen that the percentage error involved in assuming that the fugacity is equal to the pressure is the same as the percentage departure from the ideal gas law. Alternatively, the fugacity can be considered in terms of the compressibility factor Z. From Eq. (8.25)
232 Introduction to the Thermodynamics ofMaterials But Z=PV/RT, and hence and (8.28) This can be evaluated either by graphical integration of a plot of (Z 1)P vs. P at constant T or by direct integration if Z is known as a function of P, i.e., if the virial equation of state of the gas is known. For example, the variation of PV (cm3 atm) with P in the range 0 200 atm for nitrogen gas at 0 C is represented by the equation Thus, dividing by RT=22,414.6 at 0 Cgives
The Behavior of Gases 233 Figure 8.12 The variation of f/P with pressure for nitrogen gas at 0 C. This variation of Z with P is shown graphically in Fig. 8.3. From integration of Eq. (8.28), In (f/P) is obtained as This variation of f/P with P is shown in Fig.8.12. The change in the molar Gibbs free energy of an nonideal gas caused by an isothermal change in pressure can be calculated from either or The correspondence between these two approaches is illustrated as follows. The virial equation of state of the gas is
234 Introduction to the Thermodynamics ofMaterials Then and so, for the change of state of 1 mole of gas from (P1, T) to (P2, T), If the gas had been ideal,then and so the contribution to change in the molar Gibbs free energy arising from the nonideality of the gas is Alternatively, dG=RT d ln f where, from Eq.(8.29),
The Behavior of Gases 235 Now andso in agreement with the above. Thus for 1 mole of nitrogen at 0 C, the difference between the Gibbs free energy at P=150 atm and that at P=1 atm is The contribution due to the nonideality of nitrogen is thus seen to be only 76 joules in almost 11,300 joules. The number of terms which must be retained in the virial equation depends on the magnitude of the range of pressure over which it must be applied. For example, in the virial equation for nitrogen at 0 C only the first term is needed up to 6 atm and only the first two terms areneededupto20atm. When onlythe first termisneededtheexpression is or and hence BRT=a in Eq. (8.25) and a is a function only of temperature. Consider a nonideal gas which obeys the equation of state PV=RT(1+BP). The work done by this nonideal gas in a reversible, isothermal expansion from P1 to P2 is the same as that done when an ideal gas is reversibly and isothermally expanded from P1to P2at the same temperature. However, the work done by the non-ideal gas in a reversible, isothermal expansion from V1 to V2 is greater than that done when an ideal gas is
236 Introduction to the Thermodynamics ofMaterials reversibly and isothermally expanded from V1to V2at the same temperature. Consider why this is so. For the ideal gas V=RT/P, and for the nonideal gas V=RT/P+BRT. Thus, on a P-V diagram any isotherm for the nonideal gas is displaced from the isotherm for the ideal gas by the constant increment in volume BRT, as shown in Fig. 8.13. Because of the constant displacement the area under the isotherm for the ideal gas between P1and P2(the area abcd) is the same as the area under the isotherm for the nonideal gas between the same pressures (the area efgh). Thus the same amount of work is done by both gases in expanding isothermally from P1toP2. For the ideal gas, and for the nonidealgas but, as V=RT/P+BRT and hence, at constant T, dV= RT(dP/P2), then However, as any isotherm for the nonideal gas also lies above the isotherm for the ideal gas (for a positive value of B), the work done by the nonideal gas in expanding isothermally and reversibly from V1to V2(the area aijd) is greater than that done by the ideal gas in isothermally and reversibly expanding between V1and V2(the area abcd).
The Behavior of Gases 237 Figure 8.13 Isotherms for an ideal gas and a non-ideal gas. The vertical separation between the two isotherms is For the ideal gas, wideal gas=RT ln (V2/V1) and for the nonideal gas, where
238 Introduction to the Thermodynamics ofMaterials such that Consider the comparison of the behavior of hydrogen gas, for which PV= RT(1+0.0064P), with that of an ideal gas in reversible isothermal expansions of 1 mole between P1=100 atm and P2=50 atm at 298 K: Thus, for the change ofstate and At V=0.2445 liters, T=298 K, Pideal gas=100 atm, and
The Behavior of Gases 239 and at V=0.489 liters, T=298 K, Pideal gas=50 atm, and 8.8 SUMMARY An ideal gas is an assemblage of volumeless noninteracting particles which obeys the ideal gas law, PV=RT. The internal energy of an ideal gas arises solely from the translational motions of the gas particles and, hence, is a function only of temperature. The enthalpy of an ideal gas is also a function only of temperature. A consequence of the ideal gas law is that, at constant temperature, the Gibbs free energy of an ideal gas is a linear function of the logarithm of the pressure of the gas. As Gibbs free energies do not have absolute magnitudes (only differences can be measured) it is convenient to measurechangesinGibbsfreeenergyfromsomearbitrarystate.ThisstateischosenasP=1atmat the temperature of interest and is called the standard state. Thus, the difference between themolar Gibbs free energy in the state P, T and that in the standard state, P=1 atm, T is OG=RTlnP. Thedeviationsofrealgases fromidealbehaviorare causedbytheatomsormoleculesofreal gaseshavingfinitevolumesandbytheinteractionswhichoccuramongtheatoms.Various attempts have been made to correct the ideal gas law for these effects, and the best-known derived equation is the van der Waals equation of state, which can be applied to gases which show small deviations from ideality. This equation predicts the condensation of vaporcaused by compression at temperatures below the critical temperature, but does not give the correct dependence on temperature of the saturated vapor pressure of the liquid phase. Generally, measured variations of the molar volumes of gases with P and T are fitted to power series equations, in P or 1/V,of the function PV.Such equations are called virial equations. The compressibility factor, Z=PV/RT, of all real gases at constant reducedtemperature, TR=T/Tcr, is the same function of the reduced pressure, PR=P/Pcr. This gives rise to the law of corresponding states, which states that when two gases have identical values of two reduced variables, they have almost identical values of the third reduced variable. Consideration of the thermodynamic behavior of nonideal gases is facilitated introduction of the fugacity, f which is defined by the equation dG=RT d ln f and by the condition f/P 1 as P 0. Thus the standard state for a nonideal gas is that in which the fugacity is unity at the temperature of interest. For small deviations from ideality, the pressure of the gas is the geometric mean of its fugacity and Pid, the pressure which the gas would exert if it were ideal. The composition of a mixture of gases is most conveniently expressed in terms of the mole fractions of its component gases, and if the mixture is ideal, the partial pressures ex- erted by the component gases are related to the total pressure P and the mole fraction Xiby pi=XiP. This equation is called Dalton's law of partial pressures. In a mixture of by
240 Introduction to the Thermodynamics ofMaterials ideal gases the partial molar Gibbs free energy of a component gas is a linear function of the logarithm of its partial pressure, and in a mixture of nonideal gases is a linear function of the logarithm of its fugacity. As the atoms in an ideal gas do not interact with one another no change in enthalpy occurs when different ideal gases are mixed, i.e., the enthalpy change of mixing of ideal gases, OH mix, is zero. The entropy change occurring when ideal gases are mixed arises solely from complete randomization of the different types of atoms in the available volume, and thus, as OHmix=0, OGmix= TOSmix. 8.9 NUMERICALEXAMPLES Example 1 Assuming that nitrogen behaves as a van der Waals gas with a=1.39 l2 atm/mole2and b=39.1 cm3/mole, calculate the change in the Gibbs free energy and the change in entropy when the volume of 1 mole of nitrogen is increased from 1 to 2 liters at 400 K. For a van der Waals gas andthus (i) (ii) At constanttemperature
The Behavior of Gases 241 which, from Eq. (i),gives Integrating between V2 and V1gives From Eq. (6.17), at constanttemperature, where From Eq. (ii), at constantpressure
242 Introduction to the Thermodynamics ofMaterials and thus, for a van der Waals gas and Therefore, If the nitrogen had behaved as an ideal gas the changes in Gibbs free energy and entropy would have been and
The Behavior of Gases 243 Example 2 The virial equation of state for n-butane at 460 K is Z=1+A/V+B/V2in which A= 265 cm3/g mole and B=30,250 cm6/g mole2. Calculate the change in the Gibbs free energy when the volume of one mole of n-butane is decreased from 400 to 200 cm3at 460K. The equation of state is and, at constanttemperature Thus, and PROBLEMS 1. Demonstrate the law of corresponding states by writing the van der Waals equation in terms of the reduced variables. Calculate the compressibility factor for a van der Waals gas at its critical point and compare the result with the values obtained for real gases at their critical points listed in Table 8.1 Calculate the value of (6U/6V)Tfor a van der Waals gas. 2. n moles of an ideal gas A and (1 n) moles of an ideal gas B, each at 1 atm pressure, are mixed at total constant pressure. What ratio of A to B in the mixture maximizes the
244 Introduction to the Thermodynamics ofMaterials decrease in the Gibbs free energy of the system? If the decrease in the Gibbs free energy is OGM, to what value must the pressure be increased in order to increase the Gibbs free energy of the gas mixture by 3. You are responsible for the purchase of oxygen gas which, before use, will be stored at a pressure of 200 atm at 300 K in a cylindrical vessel of diameter 0.2 meters and height 2 meters. Would you prefer that the gas behaved ideally or as a van der Waals gas? The van der Waals constants for oxygen are a= 1.36 liters2 atm mole 2and b=0.0318 liter/mole. 4. The virial equation of state for n-butane at 460 K is Z=1+A/V+B/V2in which A= 265 cm3/g mole and B=30,250 cm6/g mole2. Calculate the work required to reversibly compress 1 mole of n-butane from 50 to 100 atm at 460 K. 5. For sulfur dioxide, Tcr=430.7K and Pcr=77.8atm. Calculate ? a The critical van der Waals constants for the gas b The critical volume of van der Waals SO2 c The pressure exerted by 1 mole of SO occupying a volume of 500 cm3at 500 K. 2 Compare this with the pressure which would be exerted by an ideal gas occupying the same molar volume at the same temperature. 6. One hundred moles of hydrogen gas at 298 K are reversibly and isothermally compressed from 30 to 10 liters. The van der Waals constants for hydrogen are a=0.2461 liters2 atm mole 2and b=0.02668 l/mole, and in the range of pressure 0 1500 atm, the virial equation for hydrogen is PV=RT (1+6.4 10 4P). Calculate the work that must be done on the system to effect the required change in volume and compare this with the values that would be calculated assuming that (1) hydrogen behaves as a van der Waals gas and (2) hydrogen behaves as an ideal gas. 7. Using the virial equation of state for hydrogen at 298 K given in Prob. 8.6,calculate a. The fugacity of hydrogen at 500 atm and 298 K b. The pressure at which the fugacity is twice the pressure c. The change in the Gibbs free energy caused by a compression of 1 mole of hydrogen at 298 K from 1 to 500 atm What is the magnitude of the contribution to (c) caused by the nonideality of hydrogen?