Understanding Real Gases and Condensation Phenomenon
Real gases deviate from ideal gas behavior, leading to condensation at low temperatures. The van der Waals equation accounts for real gas properties with empirical constants. The Maxwell construction method predicts the saturated vapor pressure on the isotherm, crucial for understanding liquid-vapor equilibrium. Critical isotherms reveal the critical temperature and pressure, demonstrating the limitations of gas liquefaction above the critical point.

Download Presentation

Please find below an Image/Link to download the presentation.
The content on the website is provided AS IS for your information and personal use only. It may not be sold, licensed, or shared on other websites without obtaining consent from the author. Download presentation by click this link. If you encounter any issues during the download, it is possible that the publisher has removed the file from their server.
E N D
Presentation Transcript
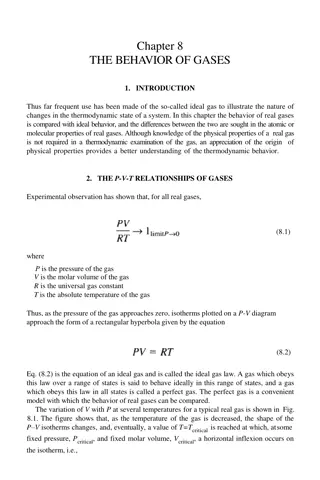
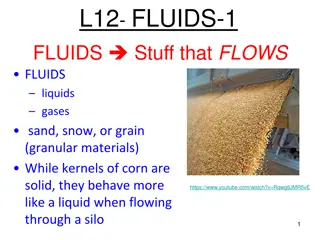
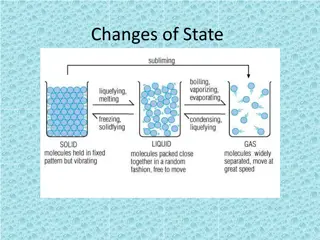
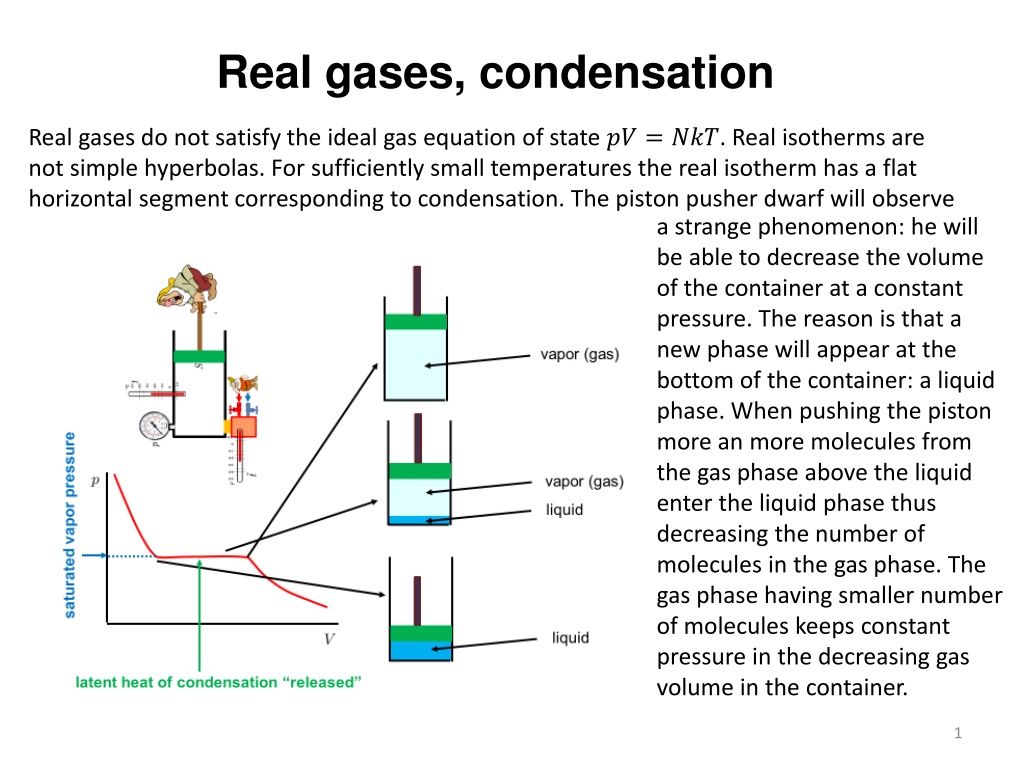
Real gases, condensation Real gases do not satisfy the ideal gas equation of state ?? = ???. Real isotherms are not simple hyperbolas. For sufficiently small temperatures the real isotherm has a flat horizontal segment corresponding to condensation. The piston pusher dwarf will observe a strange phenomenon: he will be able to decrease the volume of the container at a constant pressure. The reason is that a new phase will appear at the bottom of the container: a liquid phase. When pushing the piston more an more molecules from the gas phase above the liquid enter the liquid phase thus decreasing the number of molecules in the gas phase. The gas phase having smaller number of molecules keeps constant pressure in the decreasing gas volume in the container. 1
van der Waals equation There were several attempts to invent formulas for the real gas equation of states. The most popular in textbooks is the van der Waals equation where ?,? are empirical constants characterizing the specific gas. The equation is of the third order in ? and for the temperatures below certain critical temperature ??does not have a flat horizontal segment in the region where condensation is expected. Instead an upward rise and a downward dip is predicted by the formula. This region in the isotherm is usually interpreted as corresponding to a metastable equilibrium of overheated liquid or overcooled vapor which can be observed for very clean samples of the substance. Usually, however a flat horizontal segment of isotherm is observed. 2
Van der Waals equation: Maxwell construction It is possible to predict the position of the horizontal flat segment on the isotherm using the Van der Waals curve with the rise and dip. Maxwell construction says: substitute the rise-dip area with a horizontal line in such a way, that the areas above and below the horizontal line are equal. The pressure as given by the position of the flat horizontal line is called saturated vapor pressure. If we artificially prepare a non-equilibrium state such that the pressure of vapor is less than the saturated pressure, then during the relaxation molecules from the liquid phase will escape into the vapor phase more often then from the vapor phase into the liquid phase. This causes increasing the vapor pressure until it reaches the saturated vapor pressure, that is equilibrium. The equilibrium is dynamical: macroscopically we do not observe and changes, but on the molecular level the molecules continue to migrate between the liquid and the vapor phase in equal amounts. 3
Van der Waals equation: critical isotherm If we draw several isotherms as given by the van der Waals equation (with Maxwell modification) we observe that the higher the temperature the shorter is the flat horizontal segment and for certain temperature the flat segment is degenerated to a point. It is the isotherm marked as 2 it the figure below. This isotherm is called the critical isotherm and corresponds to the critical temperature ??. For the critical isotherm there is no need to do the Maxwell construction, since the rise-dip area degenerates to just a point: it is an inflex point on the isotherm. The point corresponds to the critical volume ??and critical pressure ??. For still higher temperatures is no rise-dip area, therefore no coexistence of liquid-vapor phases. For temperatures higher than critical it is not possible to liquify the gas just by decreasing volume and increasing pressure: one must first lower the temperature below critical value. The position of the critical point ??,??,??can be calculated from the van der Waals equation. One can for example look for temperature ??for which the isotherm has an inflex point. Technically easier way is to rewrite the van der Waals equation to a third order equation for the variable ? with ?,? as parameters and find the values of these parameters for which this third order equation has a triple (real) root ??. critical isotherm 4
Phase diagram It is clear that the saturated vapor pressure is uniquely determined by the temperature. The equilibrium between the liquid and gas phase is determined by just one macroscopic parameter, temperature or pressure. Therefore one can visualize the liquid-gas coexistence equilibrium states by a curve in a ?? diagram, called phase diagram . The liquid-gas coexistence curve is visualized in the figure below by the red curve. The curve is at high temperatures ended by the critical point. There is no liquid- gas coexistence above the critical temperature. At the critical point itself there is already no difference in physical properties between the liquid and the gas phase. The point is that there are no absolute differences between the liquid and the gas phase, only relative. So if I have liquid and gas next to each other, I can tell for example that the liquid phase is the one with higher mass density. When common people say that gas has low mass density it has just comparative meaning lower than liquid . That is why I can reversibly go from the gas phase to the liquid phase without seeing any discontinuity: it is enough to go around the critical point (the green path in the figure). Similarly to the liquid-gas coexistence curve, there are liquid-solid and gas-solid coexistence curves. The three curves meet at the triple point with ?,?,? uniquely determined 5
Phase diagram for water On the above figure showing water phase diagram we can see the water anomaly: the solid liquid (ice water) coexistence curve has a negative slope. This means that the ice melting temperature decreases with increasing pressure. The reason is that the ice mass density is lower than the liquid water density at the same temperature (ice is floating on water). We shall see it in the next slide with Clausius Clapeyron equation. 6
Clausius - Clapeyron equation Imagin a Carnot cycle working between two gas liquid coexistence temperatures ?,? ??, that is at saturated vapor pressures ?,? ??. The cycle is represented by the green cyclic path in the figure. The mechanical work produced is equal to the area inside the cycle ? = ??(?? ??). The heat obtained at the higher temperature ? is equal to the latent heat ?. From the efficiency formula for the Carnot cycle we get This is the Clausius Clapeyron equation giving the slope of the coexistence curve in the phase diagram. Similar equation holds for the liquid solid curve. For water where the solid volume is larger than the liquid volume, we get negative slope: the water anomaly. 7
Electromagnetic radiation in a hot cavity Heating stove: even if the fuel is burned out, no fire there, if you open the door you see red light. There is electromagnetic field inside heated to temperature ?. This is all we know about the field inside. We do not know the detailed state (microstate). We just have very reduced information: There is radiation in the box of volume ?, having temperature ?. This sentence describes the current macrostate. We assume that some relaxation time has already passed, so it is an equilibrium macrostate. A priori we do not know if ?,? specify the equilibrium macrostate sufficiently, so that we can start statistical physics machinery. Just assume that yes and we shall see later that ?,? is really enough. 8
Physics manifesto Select some part of the outer world, call it the system Find how to describe state of the system Find the equation of motion Predict future states Now we go to work with a new physical system: electromagnetic field. It is a new animal in the physics ZOO. So we have to show how the physics manifesto works for this new animal. System: electromagnetic field State of electromagnetic field: two vector fields What are the equations of motion, how to predict future? (This is something which is usually not much discussed in the course Theory of electromagnetic field .) Let us try our standard strategy: starting from the current state find the new state after infinitesimal time interval ??. Suggestion: try to use Maxwell equations. 9
Maxwell equations The first two equations do not contain derivatives with respect to time. They must be true in each time instant. Therefore they pose a condition on state of the electromagnetic field which must be satisfied in each time instant (in particular in initial state ). This means that the six functions describing the state cannot be chosen arbitrarily at will at each spatial point. Very imprecisely it means that because of two conditions only four of the six functions are independent. To work wit six functions of state is just technically practical in applications. In theoretical physics we, however, often describe the state by just four other functions (potentials). 10
Electromagnetic field time development The second pair of the Maxwell equations contains time derivatives, so let us try to rewrite those equations to use them to determine a new state after infinitesimal time interval ??. Suppose we know the state ? ?, ? ,?(?, ?). The state after time ?? should be The right-hand sides concern only the current time ?. Therefore they can be evaluated just knowing the current (initial) state. So we are happy: we can move forward in time. We should just check whether the first pair of the Maxwell equations will be satisfied after the time shift if they were satisfied in the initial state. One can easily check that it is true provided the charges and currents satisfy the continuity equation (which is the consequence of the charge conservation). Notice that we have considered the currents to be external entities , their time and space dependence are considered here to be given . By the way: do notice that when we want to make the time shift, we have to do it simultaneously for both electric field and magnetic field. So these two fields are not individual entities they form together a common electromagnetic field . 11
Note: boundary conditions These equations can in principle be used to predict the state after a small time interval ?? knowing the current state at the time ?. And then iterate to further future, next ??, and next ?? and so on. We can try to do it at least numerically on a computer. However, we meet two problems: numerical instabilities. We either have be very careful with the choice of steps in time and space or we have to choose more sophisticated numerical methods. This is not a sign of some essential problem we will not be able to numerically approximate the rotations in points at the boundaries. We have to use boundary conditions for the boundary points instead. This is essential and it helps us to understand why the partial differential equations force us to specify the boundary conditions. To know the initial state is not enough to predict the future. 12
Statistical physics of a new physical object: electromagnetic field So we have described a new physical object: the electromagnetic field. We know how to define its state and we know how to predict its time development. So far there was no need of statistical methods. A new situation arises when the electromagnetic field interacts with some thermal reservoir: we can imagine a stow with hot walls and the red light inside. This red light is just electromagnetic field in statistical equilibrium with the hot walls. We expect to use the technology of the canonical ensemble. It is not, however, straightforward: we were not told how to create the canonical ensemble for object whose state is described by a field theory. Fortunately there is a way how to describe the state of the free electromagnetic field in a cavity by discrete mathematical objects similar to harmonic oscillators (even if there are infinitely many oscillators required) and for such objects the application of statistical physics is well understood. 13