Understanding Data Modeling and Database Schema Design
Explore various aspects of data modeling, ranging from conceptual to physical models, using tools like CASE Tool and ArcGIS. Learn about entity-relationship diagrams, UML notations, and diagrammatic notations in the context of constructing data models. Discover the significance of classes, relationships between classes, and handling complex data structures, along with insights on representing many-to-many relationships in database schemas.
- Data Modeling
- Database Schema Design
- Entity-Relationship Diagrams
- UML Notations
- Complex Data Structures

Download Presentation

Please find below an Image/Link to download the presentation.
The content on the website is provided AS IS for your information and personal use only. It may not be sold, licensed, or shared on other websites without obtaining consent from the author. Download presentation by click this link. If you encounter any issues during the download, it is possible that the publisher has removed the file from their server.
E N D
Presentation Transcript
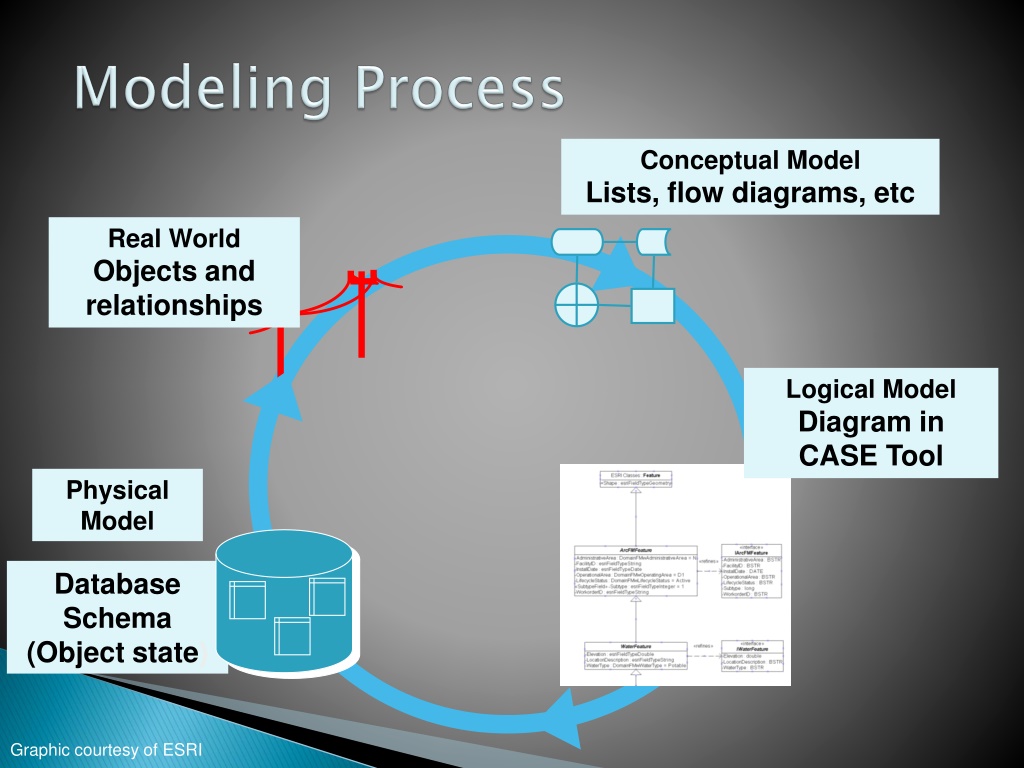
Conceptual Model Lists, flow diagrams, etc Real World Objects and relationships Logical Model Diagram in CASE Tool Physical Model Database Schema (Object state) Graphic courtesy of ESRI
Reality Human-oriented Conceptual Model Increasing Abstraction Logical Model Computer- oriented Physical Model
Entity-relationship diagrams Design the methodologies, diagram notations UML Not a design methodology Just a diagrammatic notation based on methods Endorsed by leading software and database companies
Diagrammatic notation = visual language ... For constructing a data model Drawings, relationships constructed in Visio (other tools available) Tools to input a drawing into ArcGIS input drawing to the data model
a class is shown as a box top part contains the name of the class lower part contains the attributes methods associated with the class lines connect boxes and indicate relationships
Links between classes, shown as lines One to one One to many Many to many
Kalyani Beerevelly Gautami Reddy Chitteti
Disease n n n Demographics Clinical Test 1 n n n 1 1 n Patient Followup Medical Image n 1 n n n Drug Physiology n Clinical Sample
Complex data structure with many potential dimensions Many- to- many and Uncertain relationships between fact and dimension objects Require advanced temporal support for time validity Incomplete and/or imprecise data very common
Neither Snow flake nor star schema is good to represent many-to-many relationships. BioStar model uses the concept of introducing bridge table in between fact table and dimension tables called the measure tables. The pitfall of BioStar model is - to retrieve particular data many joins are required.
TestResult ClinicalTest Diagnosis Disease DiseaseID PatientID Symptom ValidFrom ValidTo TestID PatientID Result DateTested TestID TestName TestType TestSetting DiseaseID Name Type Description Patient PatientID SSN Name Gender DOB DrugUse ClinicalSample Drug DrugID PatientID Dosage ValidFrom ValidTo SampleID PatientID Source Amount DateTaken DrugID DrugName DrugType Description
Idea--have one measure table for one or more related Dimension tables. For instance diagnosis measure table can have the measures of drug use and disease symptom since we can observe a valid relation between disease and the drugs used. This information can be very useful during the mining of the data.
Dim4 Dim1 DimKey4 . . . MTable234 MTable124 DimKey2 DimKey3 DimKey4 FactKey Measures Fact Dim1 DimKey1 DimKey2 DimKey4 FactKey Measures Dim3 FactKey . . . DimKey1 . . . DimKey3 . . . Dim2 Dim1 DimKey2 . . .
This model reduces the number of physical joins. It is easy for consolidation of few results from the measure tables which couldn t be made from bio star. For instance, from the diagnosis table it is easy to consolidate which disease has been treated using which drug. In the BioStar model, this consolidation was not possible. What could be concluded was which patient was prescribed which drug and what disease did he suffer from separately. Temporal attributes of the measure tables allow multiple entries. For instance, if the same patient is diagnosed on same day the measure tables allow in the BioWeb model.
Adding a dimension to existing measure table or adding fields in any table would require re- computing data entries of the measure table. Hence measure table should not be connected to more number of dimension tables. Connecting multiple dimension tables to one measure table might increase the size of the measure table but on the brighter side this gives some direct results which could be very useful.
By Chirag Gorasia (3454 8106) Rahul Malviya (3654 8590)
Hierarchical model Easily models 1-1 and 1-n associations as parent-child relationships. Easily extensible and scalable Very efficient to retrieve and update records. Fairly intuitive to construct. Real world implementation of Hierarchical models: www.mismo.org and IBM IMS
<clinicalData> <patient patientId=1000 SSN=000-00-0000 Name="ABC Gender= M DOB=09/16/2009 > <patientDisease diseaseId=10000 diseaseName="XXX" /> <patientDisease diseaseId=10001 diseaseName="XXY" /> </patient> <patient patientId=1001 SSN=000-00-0001 Name="ABCD Gender= F DOB=09/14/2009> <patientDisease diseaseId=10000 diseaseName="XXX" /> </patient> < patientDisease diseaseId=10000 diseaseName="XXX patient=1001,1000 /> < patientDisease diseaseId=10001 diseaseName="XXY patient=1000 /> </clinicalData>