Nebraska Youth Risk Behavior Survey 2023 Results Overview
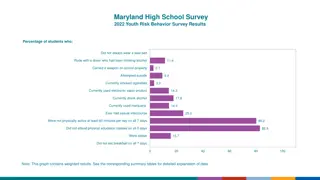
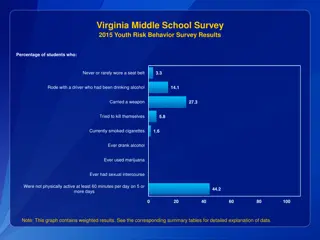
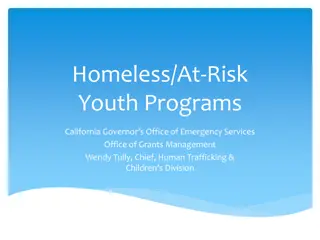
The Nebraska Youth Risk Behavior Survey (YRBS), administered biannually since 1991 by the Nebraska Department of Education, provides insights into various health-related behaviors among high school students. The survey monitors behaviors such as alcohol and drug use, tobacco use, unhealthy dietary habits, and physical inactivity. Additionally, it includes questions about Adverse Childhood Experiences (ACEs). The results reveal percentages of students who drove or rode with a driver under the influence of alcohol, categorized by sex, grade, and race/ethnicity. Trends from 2012 to 2023 show a decrease in such risky behaviors among students.

Download Presentation

Please find below an Image/Link to download the presentation.
The content on the website is provided AS IS for your information and personal use only. It may not be sold, licensed, or shared on other websites without obtaining consent from the author. Download presentation by click this link. If you encounter any issues during the download, it is possible that the publisher has removed the file from their server.
E N D
Presentation Transcript
SUBSTANCE USE 2023 RESULTS Administered by: Nebraska Department of Education jessie.coffey@nebraska.gov
Youth Risk Behavior Survey Overview Administered in Nebraska biannually since 1991. The Youth Risk Behavior Survey (YRBS) is part of the National Youth Risk Behavior Surveillance System created and managed by the Centers for Disease Control and Prevention (CDC). This statewide survey is designed to monitor categories of health-related behaviors that contribute to the leading causes of death and disability among youth and adults, including Behaviors that contribute to unintentional injuries and violence Alcohol and other drug use Tobacco use Unhealthy dietary behaviors Inadequate physical activity YRBS also measures the prevalence of obesity and asthma and other health-related behaviors plus Nebraska elected to include Adverse Childhood Experiences (ACE) questions. ACEs are categorized into three groups: abuse, neglect, and household challenges. These questions are filtered into the appropriate topic results. All Nebraska public schools are eligible to participate. In a random sample of Nebraska schools, students from a random sample of 9th-12th grade classes are asked to complete the YRBS.
Percentage of High School Students Who Drove a Car or Other Vehicle When They Had Been Drinking Alcohol,* by Sex, Grade, and Race/Ethnicity, 2023 0 20 40 60 80 100 Total 2.7 Male 3.7 Female 1.7 9th 10th 11th 12th 5.1 Percent 1.6 3.7 1.9 Black Hispanic/Latino 3.5 White Multiple 2.1 *One or more times during the 30 days before the survey, among students who had driven a car or other vehicle during the 30 days before the survey All Hispanic students are included in the Hispanic category. All other races are non-Hispanic. Missing bar indicates fewer than 30 students in the subgroup. This graph contains weighted results. Nebraska - YRBS, 2023 - QN10
Percentage of High School Students Who Drove a Car or Other Vehicle When They Had Been Drinking Alcohol,* 2012-2023 100 80 60 Percent 40 20 10.1 6.8 6.3 5.8 4.5 2.7 0 2012 2014 2016 2018 2021 2023 *One or more times during the 30 days before the survey, among students who had driven a car or other vehicle during the 30 days before the survey Decreased 2012-2023 [Based on linear and quadratic trend analyses using logistic regression models controlling for sex, race/ethnicity, and grade (p < 0.05). Significant linear trends (if present) across all available years are described first followed by linear changes in each segment of significant quadratic trends (if present).] This graph contains weighted results. Nebraska - YRBS, 2012-2023 - QN10
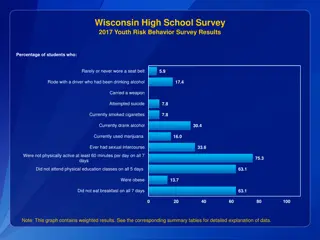
Percentage of High School Students Who Rode with a Driver Who Had Been Drinking Alcohol,* by Sex, Grade, and Race/Ethnicity, 2023 0 20 40 60 80 100 Total 11.2 Male 9.5 Female 13.1 9th 10th 11th 12th 12.0 10.8 Percent 6.6 15.4 Black Hispanic/Latino 12.1 12.9 White Multiple *In a car or other vehicle, one or more times during the 30 days before the survey All Hispanic students are included in the Hispanic category. All other races are non-Hispanic. Missing bar indicates fewer than 30 students in the subgroup. This graph contains weighted results. Nebraska - YRBS, 2023 - QN9
Percentage of High School Students Who Rode with a Driver Who Had Been Drinking Alcohol,* 2003-2023 100 80 60 Percent 38.5 35.6 40 23.9 22.3 22.1 20.3 14.8 14.6 20 11.2 0 2003 2005 2007 2009 2010 2012 2014 2016 2018 2021 2023 *In a car or other vehicle, one or more times during the 30 days before the survey Decreased 2003-2023 [Based on linear and quadratic trend analyses using logistic regression models controlling for sex, race/ethnicity, and grade (p < 0.05). Significant linear trends (if present) across all available years are described first followed by linear changes in each segment of significant quadratic trends (if present).] Data not available for 2007, 2009. This graph contains weighted results. Nebraska - YRBS, 2003-2023 - QN9
Percentage of High School Students Who Ever Smoked a Cigarette,* by Sex, Grade, and Race/Ethnicity, 2023 0 20 40 60 80 100 Total 10.8 Male 11.2 10.3 Female 9th 10th 11th 12th 7.6 6.3 Percent 8.5 20.1 Black Hispanic/Latino 7.1 White Multiple 10.3 *Even one or two puffs 12th > 10th (Based on t-test analysis, p < 0.05.) All Hispanic students are included in the Hispanic category. All other races are non-Hispanic. Missing bar indicates fewer than 30 students in the subgroup. This graph contains weighted results. Nebraska - YRBS, 2023 - QN31
Percentage of High School Students Who Ever Smoked a Cigarette,* 2003-2023 100 80 60.2 60 53.4 Percent 38.7 40 31.9 31.4 24.0 22.8 18.7 20 10.8 0 2003 2005 2007 2009 2010 2012 2014 2016 2018 2021 2023 *Even one or two puffs Decreased 2003-2023 [Based on linear and quadratic trend analyses using logistic regression models controlling for sex, race/ethnicity, and grade (p < 0.05). Significant linear trends (if present) across all available years are described first followed by linear changes in each segment of significant quadratic trends (if present).] Data not available for 2007, 2009. This graph contains weighted results. Nebraska - YRBS, 2003-2023 - QN31
Percentage of High School Students Who Smoked a Cigarette Before Age 13 Years,* by Sex, Grade, and Race/Ethnicity, 2023 0 20 40 60 80 100 Total 4.0 Male 3.4 4.6 Female 9th 10th 11th 12th 4.1 3.1 1.9 Percent 6.3 Black Hispanic/Latino 2.8 2.3 White Multiple *Even one or two puffs All Hispanic students are included in the Hispanic category. All other races are non-Hispanic. Missing bar indicates fewer than 30 students in the subgroup. This graph contains weighted results. Nebraska - YRBS, 2023 - QN32
Percentage of High School Students Who Smoked a Cigarette Before Age 13 Years,* 2016-2023 100 80 60 Percent 40 20 8.4 7.1 6.1 4.0 0 2016 2018 2021 2023 *Even one or two puffs Decreased 2016-2023 [Based on linear trend analyses using logistic regression models controlling for sex, race/ethnicity, and grade (p < 0.05).] This graph contains weighted results. Nebraska - YRBS, 2016-2023 - QN32
Percentage of High School Students Who Currently Smoked Cigarettes Frequently,* by Sex, Grade, and Race/Ethnicity, 2023 0 20 40 60 80 100 Total 0.2 Male 0.4 0.0 Female 9th 10th 11th 12th 0.8 0.0 0.0 0.0 Percent Black Hispanic/Latino 0.0 0.1 White Multiple *On 20 or more days during the 30 days before the survey All Hispanic students are included in the Hispanic category. All other races are non-Hispanic. Missing bar indicates fewer than 30 students in the subgroup. This graph contains weighted results. Nebraska - YRBS, 2023 - QNFRCIG
Percentage of High School Students Who Currently Smoked Cigarettes Frequently,* 2003-2023 100 80 60 Percent 40 20 11.2 9.6 5.8 3.7 3.0 2.1 1.2 0.2 0.1 0 2003 2005 2007 2009 2010 2012 2014 2016 2018 2021 2023 *On 20 or more days during the 30 days before the survey Decreased 2003-2023, decreased 2003-2014, decreased 2014-2023 [Based on linear and quadratic trend analyses using logistic regression models controlling for sex, race/ethnicity, and grade (p < 0.05). Significant linear trends (if present) across all available years are described first followed by linear changes in each segment of significant quadratic trends (if present).] Data not available for 2007, 2009. This graph contains weighted results. Nebraska - YRBS, 2003-2023 - QNFRCIG
Percentage of High School Students Who Currently Smoked Cigarettes Daily,* by Sex, Grade, and Race/Ethnicity, 2023 0 20 40 60 80 100 Total 0.2 Male 0.4 0.0 Female 9th 10th 11th 12th 0.8 0.0 0.0 0.0 Percent Black Hispanic/Latino 0.0 0.1 White Multiple *On all 30 days during the 30 days before the survey All Hispanic students are included in the Hispanic category. All other races are non-Hispanic. Missing bar indicates fewer than 30 students in the subgroup. This graph contains weighted results. Nebraska - YRBS, 2023 - QNDAYCIG
Percentage of High School Students Who Currently Smoked Cigarettes Daily,* 2003- 2023 100 80 60 Percent 40 20 8.3 7.0 4.1 2.6 2.4 1.2 0.9 0.2 0.1 0 2003 2005 2007 2009 2010 2012 2014 2016 2018 2021 2023 *On all 30 days during the 30 days before the survey Decreased 2003-2023, decreased 2003-2014, decreased 2014-2023 [Based on linear and quadratic trend analyses using logistic regression models controlling for sex, race/ethnicity, and grade (p < 0.05). Significant linear trends (if present) across all available years are described first followed by linear changes in each segment of significant quadratic trends (if present).] Data not available for 2007, 2009. This graph contains weighted results. Nebraska - YRBS, 2003-2023 - QNDAYCIG
Percentage of High School Students Who Currently Smoked Cigarettes,* by Sex, Grade, and Race/Ethnicity, 2023 0 20 40 60 80 100 Total 1.9 Male 2.2 1.5 Female 9th 10th 11th 12th 1.4 1.9 1.2 Percent 3.0 Black Hispanic/Latino 2.3 1.9 White Multiple *On at least 1 day during the 30 days before the survey All Hispanic students are included in the Hispanic category. All other races are non-Hispanic. Missing bar indicates fewer than 30 students in the subgroup. This graph contains weighted results. Nebraska - YRBS, 2023 - QN33
Percentage of High School Students Who Currently Smoked Cigarettes,* 2003-2023 100 80 60 Percent 40 24.1 21.8 15.0 20 13.3 10.9 7.4 4.2 3.6 1.9 0 2003 2005 2007 2009 2010 2012 2014 2016 2018 2021 2023 *On at least 1 day during the 30 days before the survey Decreased 2003-2023, decreased 2003-2014, decreased 2014-2023 [Based on linear and quadratic trend analyses using logistic regression models controlling for sex, race/ethnicity, and grade (p < 0.05). Significant linear trends (if present) across all available years are described first followed by linear changes in each segment of significant quadratic trends (if present).] Data not available for 2007, 2009. This graph contains weighted results. Nebraska - YRBS, 2003-2023 - QN33
Percentage of High School Students Who Smoked More Than 10 Cigarettes Per Day,* by Sex, Grade, and Race/Ethnicity, 2023 0 20 40 60 80 100 Total Male Female 9th 10th 11th 12th Percent Black Hispanic/Latino White Multiple *On the days they smoked during the 30 days before the survey, among students who currently smoked cigarettes All Hispanic students are included in the Hispanic category. All other races are non-Hispanic. Missing bar indicates fewer than 30 students in the subgroup. This graph contains weighted results. Nebraska - YRBS, 2023 - QN34
Percentage of High School Students Who Ever Used an Electronic Vapor Product,* by Sex, Grade, and Race/Ethnicity, 2023 0 20 40 60 80 100 Total 22.6 Male 20.1 Female 25.3 9th 10th 11th 12th 15.1 Percent 22.4 20.5 32.2 Black Hispanic/Latino 20.9 White Multiple 23.4 *Including e-cigarettes, vapes, vape pens, e-cigars, e-hookahs, hookah pens, and mods [such as JUUL, SMOK, Suorin, Vuse, and blu] All Hispanic students are included in the Hispanic category. All other races are non-Hispanic. Missing bar indicates fewer than 30 students in the subgroup. This graph contains weighted results. Nebraska - YRBS, 2023 - QN35
Percentage of High School Students Who Ever Used an Electronic Vapor Product,* 2014-2023 100 80 60 Percent 49.2 38.2 36.1 40 33.7 22.6 20 0 2014 2016 2018 2021 2023 *Including e-cigarettes, vapes, vape pens, e-cigars, e-hookahs, hookah pens, and mods [such as JUUL, SMOK, Suorin, Vuse, and blu] Decreased 2014-2023 [Based on linear trend analyses using logistic regression models controlling for sex, race/ethnicity, and grade (p < 0.05).] This graph contains weighted results. Nebraska - YRBS, 2014-2023 - QN35
Percentage of High School Students Who Currently Used an Electronic Vapor Product,* by Sex, Grade, and Race/Ethnicity, 2023 0 20 40 60 80 100 Total 6.9 Male 6.2 7.5 Female 9th 10th 11th 12th 9.1 Percent 6.3 6.1 5.9 Black Hispanic/Latino 5.8 White Multiple 7.3 *Including e-cigarettes, vapes, vape pens, e-cigars, e-hookahs, hookah pens, and mods [such as JUUL, SMOK, Suorin, Vuse, and blu], on at least 1 day during the 30 days before the survey All Hispanic students are included in the Hispanic category. All other races are non-Hispanic. Missing bar indicates fewer than 30 students in the subgroup. This graph contains weighted results. Nebraska - YRBS, 2023 - QN36
Percentage of High School Students Who Currently Used an Electronic Vapor Product,* 2014-2023 100 80 60 Percent 40 22.3 17.1 14.7 20 9.4 6.9 0 2014 2016 2018 2021 2023 *Including e-cigarettes, vapes, vape pens, e-cigars, e-hookahs, hookah pens, and mods [such as JUUL, SMOK, Suorin, Vuse, and blu], on at least 1 day during the 30 days before the survey Decreased 2014-2023 [Based on linear trend analyses using logistic regression models controlling for sex, race/ethnicity, and grade (p < 0.05).] This graph contains weighted results. Nebraska - YRBS, 2014-2023 - QN36
Percentage of High School Students Who Currently Used Electronic Vapor Products Frequently,* by Sex, Grade, and Race/Ethnicity, 2023 0 20 40 60 80 100 Total 3.2 Male 3.0 3.3 Female 9th 10th 11th 12th 3.8 Percent 2.2 2.8 3.9 Black Hispanic/Latino 2.2 White Multiple 4.0 *On 20 or more days during the 30 days before the survey All Hispanic students are included in the Hispanic category. All other races are non-Hispanic. Missing bar indicates fewer than 30 students in the subgroup. This graph contains weighted results. Nebraska - YRBS, 2023 - QNFREVP
Percentage of High School Students Who Currently Used Electronic Vapor Products Frequently,* 2014-2023 100 80 60 Percent 40 20 6.5 6.1 3.2 2.3 1.7 0 2014 2016 2018 2021 2023 *On 20 or more days during the 30 days before the survey Increased 2014-2023 [Based on linear trend analyses using logistic regression models controlling for sex, race/ethnicity, and grade (p < 0.05).] This graph contains weighted results. Nebraska - YRBS, 2014-2023 - QNFREVP
Percentage of High School Students Who Currently Used Electronic Vapor Products Daily,* by Sex, Grade, and Race/Ethnicity, 2023 0 20 40 60 80 100 Total 2.2 Male 1.8 2.6 Female 9th 10th 11th 12th 3.8 Percent 1.4 2.0 1.6 Black Hispanic/Latino 2.2 2.5 White Multiple *On all 30 days during the 30 days before the survey All Hispanic students are included in the Hispanic category. All other races are non-Hispanic. Missing bar indicates fewer than 30 students in the subgroup. This graph contains weighted results. Nebraska - YRBS, 2023 - QNDAYEVP
Percentage of High School Students Who Currently Used Electronic Vapor Products Daily,* 2014-2023 100 80 60 Percent 40 20 5.1 4.9 2.2 1.5 1.2 0 2014 2016 2018 2021 2023 *On all 30 days during the 30 days before the survey Increased 2014-2023 [Based on linear trend analyses using logistic regression models controlling for sex, race/ethnicity, and grade (p < 0.05).] This graph contains weighted results. Nebraska - YRBS, 2014-2023 - QNDAYEVP
Percentage of High School Students Who Usually Got Their Electronic Vapor Products by Buying Them Themselves in a Convenience Store, Supermarket, Discount Store, or Gas Station,* by Sex, Grade, and Race/Ethnicity, 2023 0 20 40 60 80 100 Total 3.2 Male Female 9th 10th 11th 12th Percent Black Hispanic/Latino White Multiple 4.6 *Including e-cigarettes, vapes, vape pens, e-cigars, e-hookahs, hookah pens, and mods [such as JUUL, SMOK, Suorin, Vuse, and blu], during the 30 days before the survey, among students who currently used electronic vapor products All Hispanic students are included in the Hispanic category. All other races are non-Hispanic. Missing bar indicates fewer than 30 students in the subgroup. This graph contains weighted results. Nebraska - YRBS, 2023 - QN37
Percentage of High School Students Who Usually Got Their Electronic Vapor Products by Buying Them Themselves in a Convenience Store, Supermarket, Discount Store, or Gas Station,* 2021-2023 100 80 60 Percent 40 20 3.2 0.9 0 2021 2023 *Including e-cigarettes, vapes, vape pens, e-cigars, e-hookahs, hookah pens, and mods [such as JUUL, SMOK, Suorin, Vuse, and blu], during the 30 days before the survey, among students who currently used electronic vapor products No change 2021-2023 [Based on linear trend analyses using logistic regression models controlling for sex, race/ethnicity, and grade (p < 0.05).] This graph contains weighted results. Nebraska - YRBS, 2021-2023 - QN37
Percentage of High School Students Who Currently Smoked Cigarettes or Used Electronic Vapor Products,* by Sex, Grade, and Race/Ethnicity, 2023 0 20 40 60 80 100 Total 7.1 Male 6.7 7.5 Female 9th 10th 11th 12th 9.7 Percent 6.3 6.5 6.0 Black Hispanic/Latino 5.8 White Multiple 7.6 *On at least 1 day during the 30 days before the survey All Hispanic students are included in the Hispanic category. All other races are non-Hispanic. Missing bar indicates fewer than 30 students in the subgroup. This graph contains weighted results. Nebraska - YRBS, 2023 - QNTB5
Percentage of High School Students Who Currently Smoked Cigarettes or Used Electronic Vapor Products,* 2014-2023 100 80 60 Percent 40 24.3 17.0 14.4 20 11.9 7.1 0 2014 2016 2018 2021 2023 *On at least 1 day during the 30 days before the survey Decreased 2014-2023 [Based on linear trend analyses using logistic regression models controlling for sex, race/ethnicity, and grade (p < 0.05).] This graph contains weighted results. Nebraska - YRBS, 2014-2023 - QNTB5
Percentage of High School Students Who Currently Used Smokeless Tobacco Frequently,* by Sex, Grade, and Race/Ethnicity, 2023 0 20 40 60 80 100 Total 0.5 Male 0.6 0.4 Female 9th 10th 11th 12th 0.8 0.8 0.3 0.0 Percent Black Hispanic/Latino 1.0 0.3 White Multiple *Chewing tobacco, snuff, dip, snus, or dissolvable tobacco products [such as Copenhagen, Grizzly, Skoal, or Camel Snus], not counting any electronic vapor products, on 20 or more days during the 30 days before the survey All Hispanic students are included in the Hispanic category. All other races are non-Hispanic. Missing bar indicates fewer than 30 students in the subgroup. This graph contains weighted results. Nebraska - YRBS, 2023 - QNFRSKL
Percentage of High School Students Who Currently Used Smokeless Tobacco Frequently,* 2016-2023 100 80 60 Percent 40 20 1.5 0.9 0.5 0.5 0 2016 2018 2021 2023 *Chewing tobacco, snuff, dip, snus, or dissolvable tobacco products [such as Copenhagen, Grizzly, Skoal, or Camel Snus], not counting any electronic vapor products, on 20 or more days during the 30 days before the survey No change 2016-2023 [Based on linear trend analyses using logistic regression models controlling for sex, race/ethnicity, and grade (p < 0.05).] This graph contains weighted results. Nebraska - YRBS, 2016-2023 - QNFRSKL
Percentage of High School Students Who Currently Used Smokeless Tobacco Daily,* by Sex, Grade, and Race/Ethnicity, 2023 0 20 40 60 80 100 Total 0.5 Male 0.6 0.4 Female 9th 10th 11th 12th 0.8 0.8 0.3 0.0 Percent Black Hispanic/Latino 1.0 0.3 White Multiple *Chewing tobacco, snuff, dip, snus, or dissolvable tobacco products [such as Copenhagen, Grizzly, Skoal, or Camel Snus], not counting any electronic vapor products, on all 30 days during the 30 days before the survey All Hispanic students are included in the Hispanic category. All other races are non-Hispanic. Missing bar indicates fewer than 30 students in the subgroup. This graph contains weighted results. Nebraska - YRBS, 2023 - QNDAYSKL
Percentage of High School Students Who Currently Used Smokeless Tobacco Daily,* 2016-2023 100 80 60 Percent 40 20 1.1 0.6 0.5 0.5 0 2016 2018 2021 2023 *Chewing tobacco, snuff, dip, snus, or dissolvable tobacco products [such as Copenhagen, Grizzly, Skoal, or Camel Snus], not counting any electronic vapor products, on all 30 days during the 30 days before the survey No change 2016-2023 [Based on linear trend analyses using logistic regression models controlling for sex, race/ethnicity, and grade (p < 0.05).] This graph contains weighted results. Nebraska - YRBS, 2016-2023 - QNDAYSKL
Percentage of High School Students Who Currently Used Smokeless Tobacco,* by Sex, Grade, and Race/Ethnicity, 2023 0 20 40 60 80 100 Total 1.9 Male 3.4 Female 0.4 9th 10th 11th 12th 2.2 2.3 2.4 0.8 Percent Black Hispanic/Latino 1.7 2.3 White Multiple *Chewing tobacco, snuff, dip, snus, or dissolvable tobacco products [such as Copenhagen, Grizzly, Skoal, Camel Snus, or Velo Nicotine Lozenges], not counting any electronic vapor products, on at least 1 day during the 30 days before the survey M > F (Based on t-test analysis, p < 0.05.) All Hispanic students are included in the Hispanic category. All other races are non-Hispanic. Missing bar indicates fewer than 30 students in the subgroup. This graph contains weighted results. Nebraska - YRBS, 2023 - QN38
Percentage of High School Students Who Currently Used Smokeless Tobacco,* 2016- 2023 100 80 60 Percent 40 20 5.3 3.6 2.9 1.9 0 2016 2018 2021 2023 *Chewing tobacco, snuff, dip, snus, or dissolvable tobacco products [such as Copenhagen, Grizzly, Skoal, Camel Snus, or Velo Nicotine Lozenges], not counting any electronic vapor products, on at least 1 day during the 30 days before the survey Decreased 2016-2023 [Based on linear trend analyses using logistic regression models controlling for sex, race/ethnicity, and grade (p < 0.05).] This graph contains weighted results. Nebraska - YRBS, 2016-2023 - QN38
Percentage of High School Students Who Tried to Quit Using All Tobacco Products,* by Sex, Grade, and Race/Ethnicity, 2023 0 20 40 60 80 100 Total 64.3 Male 56.9 Female 76.2 9th 10th 11th 12th Percent Black Hispanic/Latino White Multiple 52.3 *Including cigarettes, electronic vapor products, smokeless tobacco, cigars, shisha or hookah tobacco, pipe tobacco, heated tobacco products, or nicotine pouches, during the 12 months before the survey, among students who used any tobacco products during the 12 months before the survey All Hispanic students are included in the Hispanic category. All other races are non-Hispanic. Missing bar indicates fewer than 30 students in the subgroup. This graph contains weighted results. Nebraska - YRBS, 2023 - QN40
Percentage of High School Students Who Tried to Quit Using All Tobacco Products,* 2016-2023 100 80 64.3 60 Percent 49.9 47.7 41.2 40 20 0 2016 2018 2021 2023 *Including cigarettes, electronic vapor products, smokeless tobacco, cigars, shisha or hookah tobacco, pipe tobacco, heated tobacco products, or nicotine pouches, during the 12 months before the survey, among students who used any tobacco products during the 12 months before the survey No change 2016-2023 [Based on linear trend analyses using logistic regression models controlling for sex, race/ethnicity, and grade (p < 0.05).] This graph contains weighted results. Nebraska - YRBS, 2016-2023 - QN40
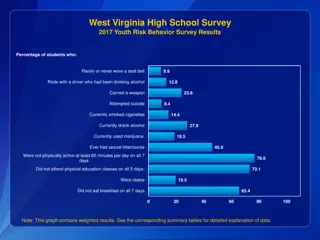
Percentage of High School Students Who Had Their First Drink of Alcohol Before Age 13 Years,* by Sex, Grade, and Race/Ethnicity, 2023 0 20 40 60 80 100 Total 9.4 Male 10.5 Female 8.2 9th 10th 11th 12th 13.4 Percent 6.4 9.1 8.7 Black Hispanic/Latino 9.7 8.6 White Multiple *Other than a few sips All Hispanic students are included in the Hispanic category. All other races are non-Hispanic. Missing bar indicates fewer than 30 students in the subgroup. This graph contains weighted results. Nebraska - YRBS, 2023 - QN41
Percentage of High School Students Who Had Their First Drink of Alcohol Before Age 13 Years,* 2003-2023 100 80 60 Percent 40 26.6 23.9 16.5 20 13.7 13.4 13.3 12.9 12.4 9.4 0 2003 2005 2007 2009 2010 2012 2014 2016 2018 2021 2023 *Other than a few sips Decreased 2003-2023, decreased 2003-2012, decreased 2012-2023 [Based on linear and quadratic trend analyses using logistic regression models controlling for sex, race/ethnicity, and grade (p < 0.05). Significant linear trends (if present) across all available years are described first followed by linear changes in each segment of significant quadratic trends (if present).] Data not available for 2007, 2009. This graph contains weighted results. Nebraska - YRBS, 2003-2023 - QN41
Percentage of High School Students Who Currently Drank Alcohol,* by Sex, Grade, and Race/Ethnicity, 2023 0 20 40 60 80 100 Total 10.8 Male 10.6 11.0 Female 9th 10th 11th 12th 8.1 9.3 Percent 13.6 12.4 Black Hispanic/Latino 7.4 White Multiple 13.1 *At least one drink of alcohol, on at least 1 day during the 30 days before the survey W > H (Based on t-test analysis, p < 0.05.) All Hispanic students are included in the Hispanic category. All other races are non-Hispanic. Missing bar indicates fewer than 30 students in the subgroup. This graph contains weighted results. Nebraska - YRBS, 2023 - QN42
Percentage of High School Students Who Currently Drank Alcohol,* 2003-2023 100 80 60 Percent 46.5 42.9 40 26.6 24.4 22.7 22.1 21.0 18.9 20 10.8 0 2003 2005 2007 2009 2010 2012 2014 2016 2018 2021 2023 *At least one drink of alcohol, on at least 1 day during the 30 days before the survey Decreased 2003-2023 [Based on linear and quadratic trend analyses using logistic regression models controlling for sex, race/ethnicity, and grade (p < 0.05). Significant linear trends (if present) across all available years are described first followed by linear changes in each segment of significant quadratic trends (if present).] Data not available for 2007, 2009. This graph contains weighted results. Nebraska - YRBS, 2003-2023 - QN42
Percentage of High School Students Who Currently Were Binge Drinking,* by Sex, Grade, and Race/Ethnicity, 2023 0 20 40 60 80 100 Total 4.1 Male 4.1 4.2 Female 9th 10th 11th 12th 3.7 2.7 Percent 5.2 5.1 Black Hispanic/Latino 3.8 5.0 White Multiple *Had four or more drinks of alcohol in a row if they were female or five or more drinks of alcohol in a row if they were male, within a couple of hours, on at least 1 day during the 30 days before the survey All Hispanic students are included in the Hispanic category. All other races are non-Hispanic. Missing bar indicates fewer than 30 students in the subgroup. This graph contains weighted results. Nebraska - YRBS, 2023 - QN43
Percentage of High School Students Who Currently Were Binge Drinking,* 2016-2023 100 80 60 Percent 40 20 10.5 9.1 8.2 4.1 0 2016 2018 2021 2023 *Had four or more drinks of alcohol in a row if they were female or five or more drinks of alcohol in a row if they were male, within a couple of hours, on at least 1 day during the 30 days before the survey Decreased 2016-2023 [Based on linear trend analyses using logistic regression models controlling for sex, race/ethnicity, and grade (p < 0.05).] This graph contains weighted results. Nebraska - YRBS, 2016-2023 - QN43
Percentage of High School Students Who Reported That the Largest Number of Drinks They Had in a Row Was 10 or More,* by Sex, Grade, and Race/Ethnicity, 2023 0 20 40 60 80 100 Total 1.3 Male 1.4 1.3 Female 9th 10th 11th 12th 3.0 Percent 1.5 0.8 0.0 Black Hispanic/Latino 3.0 White Multiple 0.9 *Within a couple of hours, during the 30 days before the survey 11th > 12th (Based on t-test analysis, p < 0.05.) All Hispanic students are included in the Hispanic category. All other races are non-Hispanic. Missing bar indicates fewer than 30 students in the subgroup. This graph contains weighted results. Nebraska - YRBS, 2023 - QN44
Percentage of High School Students Who Reported That the Largest Number of Drinks They Had in a Row Was 10 or More,* 2018-2023 100 80 60 Percent 40 20 3.6 1.8 1.3 0 2018 2021 2023 *Within a couple of hours, during the 30 days before the survey No change 2018-2023 [Based on linear trend analyses using logistic regression models controlling for sex, race/ethnicity, and grade (p < 0.05).] This graph contains weighted results. Nebraska - YRBS, 2018-2023 - QN44
Percentage of High School Students Who Usually Got the Alcohol They Drank by Someone Giving It to Them,* by Sex, Grade, and Race/Ethnicity, 2023 0 20 40 60 80 100 Total 51.0 Male 40.4 Female 61.6 9th 10th 11th 12th Percent Black Hispanic/Latino White Multiple 60.1 *During the 30 days before the survey, among students who currently drank alcohol All Hispanic students are included in the Hispanic category. All other races are non-Hispanic. Missing bar indicates fewer than 30 students in the subgroup. This graph contains weighted results. Nebraska - YRBS, 2023 - QN45
Percentage of High School Students Who Usually Got the Alcohol They Drank by Someone Giving It to Them,* 2010-2023 100 80 60 51.0 Percent 39.6 39.1 38.0 37.5 35.2 40 31.7 20 0 2010 2012 2014 2016 2018 2021 2023 *During the 30 days before the survey, among students who currently drank alcohol No change 2010-2023 [Based on linear and quadratic trend analyses using logistic regression models controlling for sex, race/ethnicity, and grade (p < 0.05). Significant linear trends (if present) across all available years are described first followed by linear changes in each segment of significant quadratic trends (if present).] This graph contains weighted results. Nebraska - YRBS, 2010-2023 - QN45
Percentage of High School Students Who Ever Used Marijuana,* by Sex, Grade, and Race/Ethnicity, 2023 0 20 40 60 80 100 Total 14.4 Male 14.1 14.7 Female 9th 10th 11th 12th 8.8 Percent 12.1 17.0 20.2 Black Hispanic/Latino 11.9 White Multiple 15.3 *One or more times during their life 11th > 9th (Based on t-test analysis, p < 0.05.) All Hispanic students are included in the Hispanic category. All other races are non-Hispanic. Missing bar indicates fewer than 30 students in the subgroup. This graph contains weighted results. Nebraska - YRBS, 2023 - QN46
Percentage of High School Students Who Ever Used Marijuana,* 2003-2023 100 80 60 Percent 34.6 40 32.3 26.6 25.6 25.4 25.0 23.6 18.7 14.4 20 0 2003 2005 2007 2009 2010 2012 2014 2016 2018 2021 2023 *One or more times during their life Decreased 2003-2023 [Based on linear and quadratic trend analyses using logistic regression models controlling for sex, race/ethnicity, and grade (p < 0.05). Significant linear trends (if present) across all available years are described first followed by linear changes in each segment of significant quadratic trends (if present).] Data not available for 2007, 2009. This graph contains weighted results. Nebraska - YRBS, 2003-2023 - QN46
Percentage of High School Students Who Tried Marijuana for the First Time Before Age 13 Years, by Sex, Grade, and Race/Ethnicity, 2023 0 20 40 60 80 100 Total 3.2 Male 2.6 3.9 Female 9th 10th 11th 12th 3.5 Percent 6.4 2.1 0.8 Black Hispanic/Latino 2.5 2.6 White Multiple All Hispanic students are included in the Hispanic category. All other races are non-Hispanic. Missing bar indicates fewer than 30 students in the subgroup. This graph contains weighted results. Nebraska - YRBS, 2023 - QN47