Analysis of Backblaze Hard Drive Data: Insights and Challenges
Explore the Backblaze hard drive data analyzed by Peng Liu and Leo Wright, focusing on issues like missing data, problematic entries, and life distributions. Discover the impact of SMART sensors on drive predictability and uncover quality issues affecting failure rate assessments in this comprehensive study.

Download Presentation

Please find below an Image/Link to download the presentation.
The content on the website is provided AS IS for your information and personal use only. It may not be sold, licensed, or shared on other websites without obtaining consent from the author. Download presentation by click this link. If you encounter any issues during the download, it is possible that the publisher has removed the file from their server.
E N D
Presentation Transcript
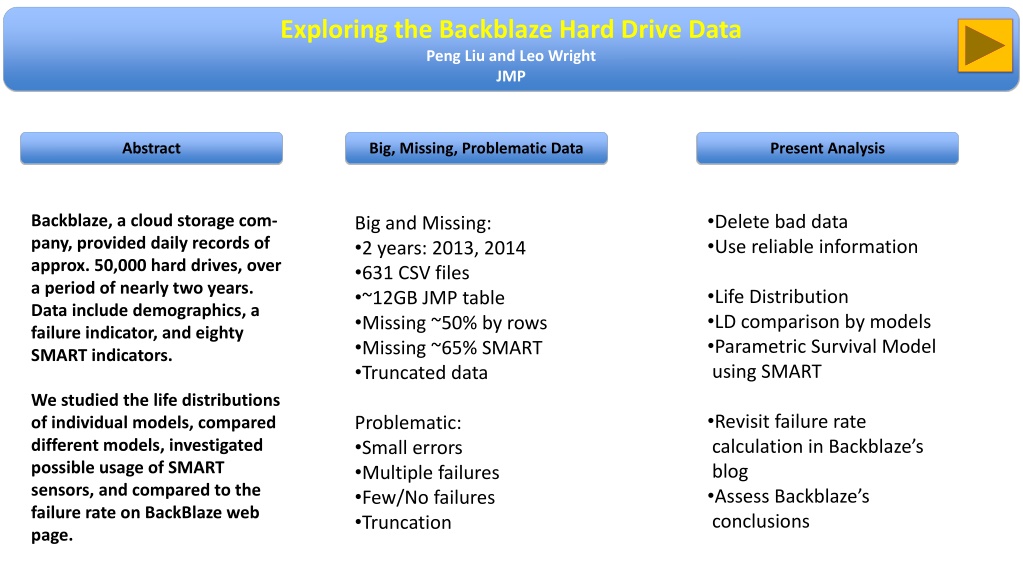
Exploring the Backblaze Hard Drive Data Peng Liu and Leo Wright JMP Big, Missing, Problematic Data Abstract Present Analysis Delete bad data Use reliable information Backblaze, a cloud storage com- pany, provided daily records of approx. 50,000 hard drives, over a period of nearly two years. Data include demographics, a failure indicator, and eighty SMART indicators. Big and Missing: 2 years: 2013, 2014 631 CSV files ~12GB JMP table Missing ~50% by rows Missing ~65% SMART Truncated data Life Distribution LD comparison by models Parametric Survival Model using SMART We studied the life distributions of individual models, compared different models, investigated possible usage of SMART sensors, and compared to the failure rate on BackBlaze web page. Revisit failure rate calculation in Backblaze s blog Assess Backblaze s conclusions Problematic: Small errors Multiple failures Few/No failures Truncation
Exploring the Backblaze Hard Drive Data Data Processing Peng Liu and Leo Wright JMP Flow Chart of Data Processing Capacities by Models Easy Fix Data Error Sum of Failure by Serial Numbers Multiple Failures Delete or Assume Mistakes Row Counts and Max SMART 9 by serial number Import CSV and merge Missing Rows Cannot Fix, Truncated Data Missing Data Pattern Missing SMART Cannot Fix, Missing Data Credibility of Life Span Row Counts, etc. by S/N Use SMART 9, Remove Bad serial number
Exploring the Backblaze Hard Drive Data Life Distributions Peng Liu and Leo Wright JMP Zero or few failures, truncations, sample sizes. Numerous data quality issues to manage! 33 models have at least 2 failed drives. The graph draws MTTFs and corresponding confidence intervals. Sample sizes of those models are plotted. There is no evidence that any manufacturer produces hard drives more reliably than another. The truncation issues alter our results. For example, the MTTF (Weibull) lower bound for a Seagate drive in the graph is 15790 days without considering truncation; it is 23764 days otherwise. In some cases, it led to convergence issues.
Exploring the Backblaze Hard Drive Data SMART Predictability Peng Liu and Leo Wright JMP SMART sensors may be useful. Using the final readings, fit a Parametric Survival model. Treat factor levels, such as temperature as constant. For trends, such as cycle counts and error counts, assume a cumulative damage model where damage is proportionally cumulative to the logarithm of the life. A Seagate disk SMART 194 Temperature SMART 190 Temperature SMART 241 Total LBA Written The positive correlation between temperature and failure time is most likely due to intensive read/write operations. Total LBA Written is a cumulative measurement of write operations, which is a reasonable indicator of usage. Different hard drive models yield different sets of significant indicators.
Exploring the Backblaze Hard Drive Data Problems in Backblazes Analysis Peng Liu and Leo Wright JMP Failure rate: the average number of failures you can expect running one drive for a year. A failure is when we have to replace a drive in a pod. That is the reciprocal of a mean time to failure (MTTF)! Backblaze s calculation is unique. Given a period of time, for each day, count the total number of drives in service, N[i]. Add up all counts, N=sum of N[i] s. Count all failure incidences during the period, K. The failure rate is K/N per day, and 365*K/N per year. The Problem: Suppose we conduct two experiments on two different days. On the first day, we set up 1000 hard drives of the same model, brand new, in service. Now consider these units have been in service many months, some of those drives have failed, but 500 of them are still in service. So on a particular day, the number in service and failed units are changing with the age. What do you expect the failure probabilities of individual drives on those two days? Are they the same? Furthermore, due to truncation (missing data), estimated failure rates are inflated since the denominator may be less than true value. Final Conclusion We dispute Backblaze s conclusion. The data, as it exists, cannot be used to conclude any hard drive or manufacturer is better than another. We found that some SMART indicators may be useful to predict failures.