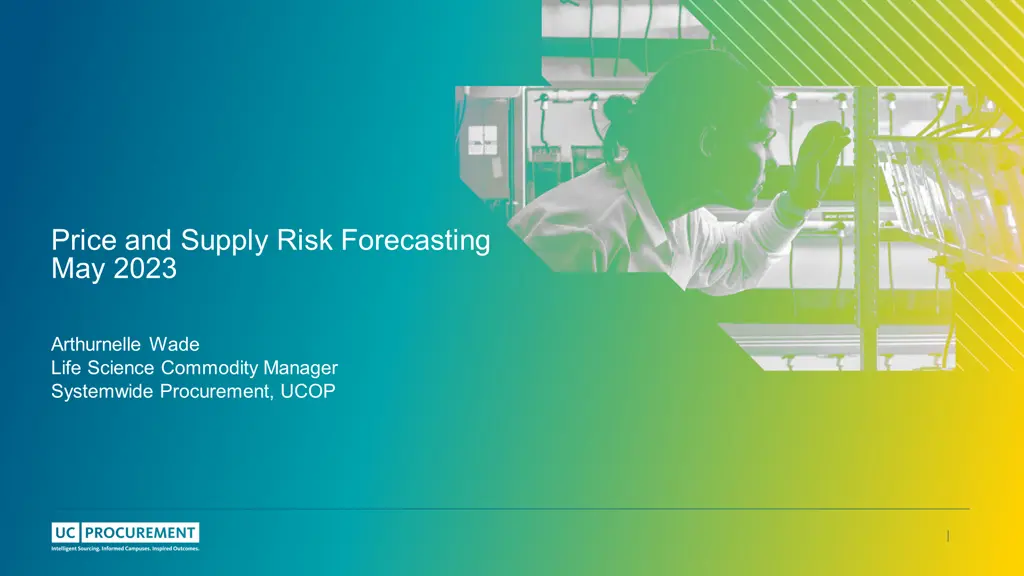
Price and Supply Risk Forecasting May 2023
Stay updated on the latest Consumer Price Index trends, construction cost index, and supply chain risks in May 2023. Get insights from Arthurnelle Wade, Life Science Commodity Manager at UCOP.
Download Presentation
Please find below an Image/Link to download the presentation.
The content on the website is provided AS IS for your information and personal use only. It may not be sold, licensed, or shared on other websites without obtaining consent from the author. Download presentation by click this link. If you encounter any issues during the download, it is possible that the publisher has removed the file from their server.

Presentation Transcript
Price and Supply Risk Forecasting May 2023 Arthurnelle Wade Life Science Commodity Manager Systemwide Procurement, UCOP
CPI Data Summary Food +7.7% annual/+0% month At Home: +7.1% /-0.2% Away: +8.6%/+0.4% Consumer Price Index Trend All1 In April, the Consumer Price Index for All Urban Consumers increased 0.4 percent, seasonally adjusted, and rose 4.9 percent over the last 12 months, not seasonally adjusted. The index for all items less food and energy increased 0.4 percent in April (SA); up 5.5 percent over the year (NSA). Medical Care Services +%0.4 annual/-0.1% month Professional Services: +2.2%/ 0.1% Hospital Services: +2.9%/ 0.5% Medical Care Goods +4% annual/+0.5% month Drugs: +3.6%/+0.4% Medical equipment and supplies: +9.9%/+0.9% +4.9% +0.4% CPI month to month change seasonally adjusted. CPI Unadjusted 12 Months ended Gasoline -12.2% annual/+3% month April 2023 CPI West Region +4.9% +0.5% Delivery Services +6.9% annual/+0.2% month Postage: +6.7%/+0.3% Delivery: +7.4%/-0.6% CPI Los Angeles Area +3.8 % +4.2% CPI San Diego Area 2 +5.3% +1% 0.7% Public Trans +0.3% annual/-0.5% month Airfare: -0.9%/-2.6% Intracity: 0%/+0.5% CPI Riverside Area 2 +4.6% CPI San Francisco Area 2 +1.3% +.4% 1.U.S. Bureau of Labor Statistics April 2023 release May 2023. 2.BLS releases data for San Diego, Riverside Area, and San Francisco every 2 months.
Index Data Summary Construction California Construction Cost Index2 April 2023 +6.9% Annual change +6.2% Building Cost Index1 +3.5% +0.7% Monthly change Driven by bricklayers, carpenters and structural ironworker s rates, and cost of structural steel shapes, Portland cement and 2x4 lumber over the last 12 months For all Urban Consumers. Information Technology, Hardware and Services in U.S. City Average BCI Unadjusted 12 Months ended April 2023 BCI Los Angeles Area (Mar 23) +5.3% BCI San Francisco Area (Mar 23) +8.1% Stayed flat from previous month +7.6% +4.4% Annual change Monthly change Annual change Monthly change -0.9% Materials Cost Index1 +2.2% MCI Los Angeles Area (Mar 23) -3.5% MCI San Francisco Area (Mar 23) -0.4% Driven by Steel Pipe, copper and brass mill shapes, lumber, metal joists and rebar price increases over the last 12 months -0.2% -5.2% MCI Unadjusted 12 Months ended April 2023 Stayed flat from previous month Annual change Monthly change Annual change Monthly change 2.The California Department of General Services publishes the California Construction Cost Index (CCCI) which is developed based upon Building Cost Index (BCI) cost indices average for San Francisco and Los Angeles ONLY as produced by Engineering News Record (ENR) and reported in the second issue each month. 1.Per Engineering News-Record. The BCI uses 68.38 hours of skilled labor, multiplied by the 20- city wage- fringe average for three trades bricklayers, carpenters and structural ironworkers. The MCI uses 25 cwt of fabricated standard structural steel at the 20-city average price, 1.128 tons of bulk portland cement priced locally and 1,088 board ft of 2x4 lumber priced locally May 3, 2023 Data
Supply Chain Risk Summary Current Conditions 3 The job markets in the US and UK showed some signs of cooling, as job openings fell to the lowest level in almost two years. Hence, may be a sign that higher interest rates are beginning to impact the labor market. After the round of tech layoffs in late 2022 and early 2023, companies across other sectors are moving to slash jobs and cut costs amid a difficult economic landscape. Fewer jobs were added to economy as effects from the Fed s interest rate increases take hold. Labor Decreased Strain Demand for transportation services continues to soften. Warehousing capacity still is constrained as inventory levels remain at some of their highest levels, meaning costs will remain high until utilization and availability improve. Demand for road services in the US and EU has softened, and lower diesel costs are a welcome relief. Logistics Decreased Strain Food prices rose by 1.9% and beverage prices increased by 5.5%, thus some easing in the food production sector still households globally are struggling with price increases. Energy prices increased again by 5.7% in April, led by crude oil (+7.8%) and coal (+3.8%). Raw materials has a moderate increase of 1% and a slight decrease in metal prices of 1%. Commodity prices are projected to fall by 21% in 2023 and remain stable in 2024. Decreased Strain Materials 3. Source: Gartner Monthly Supply Chain Alert
Summary: KEY highlights with potential UC impacts: Moderate Risks: New Additions: Construction: Continued demand is causing strain on qualified contractors and corresponding workforce Materials costs leveling with focus on manufacturing facility construction MRO: Lack of drivers, higher fuel costs, China increase on demand affect availability and pricing Life Sci Clinical/Campus: VWR: Expect many impacted categories but some supply improvements in selective categories Food: Shortage in supply of potatoes and shelled eggs Increase in feed and grain cost Logistics: Driver turnover and fuel prices recently improved, but remain high MRO: Shifts from plastic to paper options and pulp production are affecting the paper industry Energy/Utilities: Energy pricing has been stabilizing Life Sci Clinical/Campus: MS: Chemicals price increases (10-20%) Controlled substances and Adderall shortages We remain on 60% allocation w/gases, but helium supply will be worse in summer Infant formula allocation affects animal care. Medline for alternatives/process IT: Supply shortages appear to be easing Professional Services: Labor shortages with low unemployment rates, decreased labor force participation rates, and higher labor rates High Risks: Construction: Long lead times and a cost index increase of 10.4% from 2023 and 2024 Food: Supply shortage in all Northern California for crops due to weather IMPORTANT - THIS IS A SUMMARY, PLEASE BE SURE TO READ SLIDES 6-10 FOR ADDITONAL DETAILS AND MITIGATING ACTIONS. 12/21/2023 5
Current Supply Chain UC Risks and Actions Category Product Situation Risk Impact/ Probability Mitigating Actions to Address Outlook National nonresidential construction spending increased by 0.7% in March to a seasonally adjusted annualized basis of $997.1 billion, according an Associated Builders and Contractors (ABC) analysis. The manufacturing construction boom continues to predominantly account for the increase, according to ABC Non-residential construction spending increased for the 10th time in the past 11 months. The expansion in nonresidential investment is attributable to manufacturing Continued increases in non-residential construction will continue to put strains on a low skilled and trained construction workforce, potentially resulting in less competition and availability of competent firms for project delivery. Ensure qualifications for firms and availability for key individuals are confirmed to be available. Non- Probable Construction residential construction Monitor new and renovation projects for major equipment needs. Identify if funding strategy can accommodate early release of key equipment. Source - SourceBlue 2022 Fourth Quarter Update Consider delaying noncritical projects as buying power is expected to improve in the next year. Lead times for HVAC equipment are in excess of 25-65 weeks and Electrical Equipment and Generators are in excess of 52-100 weeks dependent on manufacturer and size of equipment. MEP equipment manufacturers continue to publish price increases. The MEP Cost index is at 204 which represent a 10.4% increase between 2023 and 2024 Electrical, Telecom and HVAC Equipment Construction Probable Prices for PVC pipe products fell 0.1% in March after decreasing 0.5% in February, according to the Bureau of Labor Statistics producer price index for plastic construction products, which consists largely of PVC pipe. The annual escalation sits at 3%. ENR s 20-city average price for both types of copper water tubing experienced yearly increases in May. Monthly prices for 6-in. ductile iron pipe decreased 0.4%, while yearly prices experienced a rise of 14.3% since May 2022. Despite an overall softening of the economy and continued recession concerns, materials remain static in their pricing. Recommend looking at strategies to lock in material pricing as soon as possible. Probable Construction Materials Risk Impact Low Med High 12/21/2023 Risk probability Improbable Possible Probable
Current Supply Chain UC Risks and Actions Category Product Situation Risk Impact/ Probability Mitigating Actions to Address Outlook Dry food Goods. Market is stable for now but will see destabilization due to heavy rains. Potatoes increased 40% due to crop shortages Wage increases Most campuses are not deviating from what they currently have on the menu. We should see the impact of the either, on the food markets in the next few weeks. Grain are still high due to the war in Ukraine. Probable Dry food Good, Frozen, Grains Food - General Red meats and poultry have stabilized. As I mentioned above, the weather situation nationwide has, or sill affect the feed market and we should see increases in the meat and poultry commodities. Fresh/Frozen Red meats, Poultry, Egg products, liquid dairy Food Increased cost of labor and feed cost Shelled eggs shortage of supply Probable Proteins/Dairy Produce, green leaf (80% of crops) and some fruit products (20% crops) ie. strawberries which is affected by the flooding, in Watsonville and Monterey county. Typically, it takes 90 days to grow to full crops for green leaf and 60-70 days for strawberries. Mitigation is that we will see better crops after a full cycle of 110 to 120 days for green leaf and estimate of 70 days for Strawberries. Due to heavy rains and flooding in Monterey County and Watsonville, we will see shortages on all Northern California crops {including green leaf and fruit (Strawberries)} for the next 3 to 4 months. Probable Food Produce Risk Impact Low Med High 12/21/2023 Risk probability Improbable Possible Probable
Current Supply Chain UC Risks and Actions Category Product Situation Risk Impact/ Probability Mitigating Actions to Address Outlook Supplier exploring use of autonomous vehicles; Enhanced efforts by supplier for recruitment and training of drivers. Supplier shifting to containerized shipping to create additional efficiency. Truck driver shortage, particularly for long-distance drivers. Cost of diesel fuel in California is $4.90 per gallon as of 5/1/23. Although this is a decrease of 29% from a high in June 2022, it is still up 23% compared to this time last year. Household Moving and Relocation Logistics Probable Pulp pricing is very high due to lower wood pulp production. The worst may be over as the import price index for wood pulp in the United States peaked at 137.1 in October 2022 and has since fallen to 131.6 in March 2023 Food containers, packaging, and shifts from plastic to paper options are also affecting the paper industry and will continue to transform the supply chain. Pricing stabilizing but there are still supply constraints. Review virgin paper certifications for source material. Procurement IQ suggest that negotiating conditions will become harsher in the next year. Consider using pre-negotiated agreements. Probable Paper Paper Pulp Office Furniture, Tables, seating, Freestanding Furniture, Systems Furniture, storage and accessories Steel prices have increase due to China ending it's zero Covid policy - as the larger consumer of steal, the end of the policy has led to an increase in usage. Logistics remains a challenge in this area with a lack of drivers and higher fuel costs. Evaluate reupholstering services to freshen furniture as opposed to buying new. Probable Furniture Anticipate suppliers to share costs Reach out to your campus Energy Managers for arrangements around energy savings. Natural Gas and Electricity Generation Energy: Utilities Probable Energy pricing has been stabilizing Risk Impact Low Med High 12/21/2023 Risk probability Improbable Possible Probable
Current Supply Chain UC Risks and Actions Risk Impact/ Probability Category Product Situation Mitigating Actions to Address Outlook Medline provided a temporary solution. Need to change packaging volume and order only when in stock to prevent rejection of order. As a second option, UC Davis Med Center can support for immediate relief and assistance with a large purchase from Medline. Infant formula is on allocation. Animal Care is unable to purchase formula due to insufficient supply for humans. Spike in usage due to birthing season. Probable Life Sciences Animal nutrition We remain on allocation with Airgas and Matheson around 60%, but helium supply will become worse in the coming months. The BLM had a 10-day shutdown commencing on April 17. ExxonMobil is planning a 30-day shutdown starting July 10th. This will stress the market from now into the fall. Please plan ahead, and work with your Airgas or Matheson rep to ensure coverage over the summer Probable Life Sciences Gases Millipore Sigma update: Chemicals price increases (10-20%). Many raw chemicals are produced in China and Europe. As of July 1st, 2022, the Superfund Chemical Excise Tax was reinstated which impacts roughly 200 chemicals and these taxes are being passed along to us. Provide options/alternatives to end users, maintain good communication with suppliers Life Sciences Clinical/Campus Probable Chemicals Two campuses recently reported pharmaceuticals for animal care are difficult to obtain. Animal care pharmaceuticals are not readily available for vet class of trade. UCD and UCI report availability of animal care pharmaceuticals is an issue. About 5 suppliers are used. The largest supplier MWi will not contract with UC. Local campus buyers are managing through multiple suppliers. An RFP may be advisable, but uncertain if our low volume usage will motivate suppliers to participate or guarantee product availability. Life Sciences Clinical/Campus Medications/ Pharmaceuticals Probable Risk Impact Low Med High 12/21/2023 Risk probability Improbable Possible Probable
Current Supply Chain UC Risks and Actions Category Product Situation Risk Impact/ Probability Mitigating Actions to Address Outlook VWR/Avantor reports Q2 2023: There are many impacted categories to remain constrain through 2023 and some supply improvements in selective categories. Raw material supply constraints for Direct Dispense Bags, TRIS and TRIS HCI are gradually recovering. Centrifuge Tubes turned green last quarter. Both green room and exam gloves have improved. Serological Pipets, Filtration Capsules, blood Collection Tubes, PCS Plasticware and apparel have seen improvements. PETG still limitations while PET bottles are available with slightly extended lead times. Cryogenic vials has capacity constraints through 2023. On-time performance continues to improve. Avantor is monitoring and mitigating risks to keep product moving including appointing dedicated planners to optimize FTL/LTL loads, using air mode is necessary, developing future proof and sustainable transportation solutions. Provide options/alternatives to end users, maintain good communication with suppliers Life Sciences Clinical/Campus Probable Lab consumables Global Semiconductor demand is slowing, easing supply shortages for industrial and high-tech manufacturers. Supply chain improving on some products, backlogs are seeing improved deliveries. 2nd half of 2023 could see significant improvement Still continue to monitor. Probable IT IT equipment The business and professional services labor market is among those affected by the labor shortage, with 38.5% of job openings in this field remaining unfilled in February 2023. Labor shortages have been a fixture of most labor markets in the United States since the pandemic due to an unprecedented 3.2% decrease in the labor force participation rate during the pandemic and the stagnation of the working-age population as the largest generation in American history reaches retirement age. Tightness in the labor market has continued into 2023, with the unemployment rate currently at 3.4%, its lowest point since 1969. Professional Services Temporary Staffing Probable As a result, temporary clerical and administrative staffing firms may face difficulties in finding workers for a position or higher labor costs, which they will pass along to buyers. Risk Impact Low Med High 12/21/2023 Risk probability Improbable Possible Probable
Thank You Questions or Feedback, Please contact Arthurnelle Wade Arthurnelle.Wade@ucop.edu