Enhancing Supply Chain Performance Through Collaborative Planning and Decision Support
 undefined


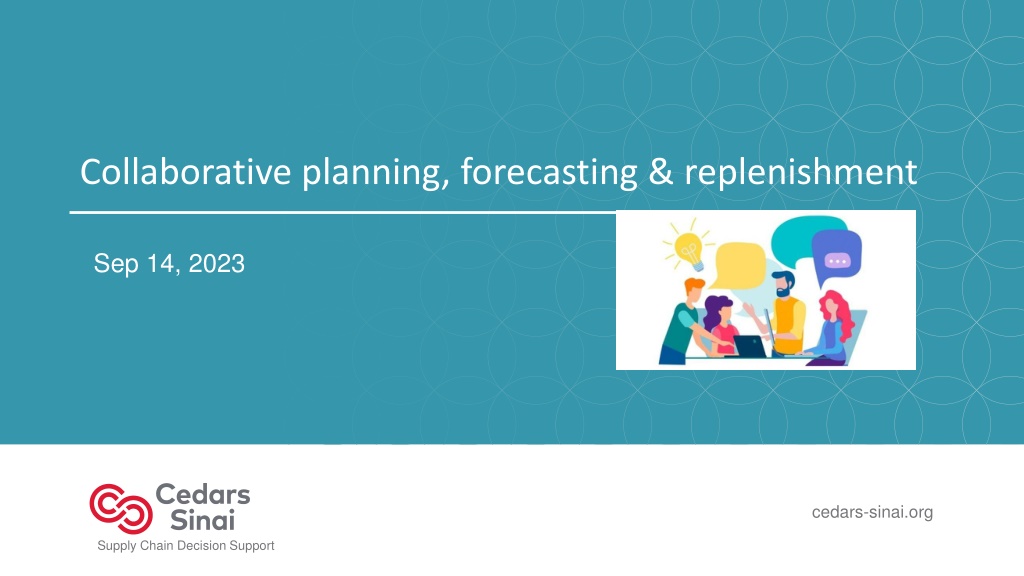
Collaborative planning, forecasting & replenishment
Sep 14, 2023


Supply Chain Decision Support


Sources: 2 primary

•
Key Distributor:
Medline
•
Other distributors

Hospital Network

“Control Room”
Warehouse Facility

Delivery methods: 3 types


1.
Palletized bulk deliveries:
•
Minimal; switched to LUM
Our product flow
1. Distributor
2. Direct Buys


Deliveries to Central Issues, CI;

Other Locations
3. Parcel deliveries


PO transmitted to distributor: EDI


2. LUM deliveries


Order placed directly with supplier


CI replens PAR LOCs


CI replens PAR LOCs

Main Hospital


Supply Chain Decision Support
What wasn’t working…
3
•
Pandemic & other global events impacted fill rates & cycle time to serve
•
Fill rate: Killed orders were 4 – 5x their “normal” levels
•
Cycle time: Requisition to PO times increased due to supply shortages & transmission delays
•
Item level demand affected by backorders; skewed visibility on “usage” with prior calculation method
•
Impact on forecast & stocking levels
•
Manual processes time consuming for both Cedars-Sinai & Medline teams
•
Multiple reports for team members to review on both sides
•
Data misalignment causing delays in resolution
Supply Chain Decision Support
Our mission:
•
Improve unadjusted fill rate performance to > 98%
Our approach:
•
Jointly drive towards an innovative demand/supply planning approach
•
Leverage Collaborative Planning, Forecasting & Replenishment, CPFR
•
Originally CFAR, Collaborative Forecasting & Replenishment, started in retail ~1995
Our joint mission was to improve unadjusted fill rate performance to > 98%
4
Our fill rates were below expectations
Unadjusted rates fell to below 94%
Time
Fill rate %
Minimum acceptable level band
Supply Chain Decision Support
We started by sharing data & logic. Huge win!
5
9* separate data outputs consolidated into 1!
Demand reports calibrated against PO history
Stock levels
: within all our locations
Product risk rating
s: Internal & Medline
*
4 from Medline; 5 from Cedars-Sinai
DATA
DATA
Supply Chain Decision Support
Developed automated workflow: reduced manual look-ups; consolidated view
6
Developed an automated workflow to generate consolidated file for review
Discussed logic for calculations
Questioned items that didn’t make sense
Adopted weekly auto file transfers
Weekly aut
o outputs
Exceptions reviewed a
s team
Supply Chain Decision Support
CPFR*: Jointly driving toward an innovative demand/supply planning approach
*CPFR = Collaborative Planning, Forecasting & Replenishment
7
Decreased time in weekly calls by ~3 hours, using a consolidated planning report
Review calls currently < 20 minutes long; switched to a bi-weekly schedule recently
Current: ~30 minutes per Medline month
Created a brain-trust for optimized patient care demand/supply planning
Automated workflow; consolidated output; fine-tuning in progress
Increased visibility around stock levels & subs within network
Subs info contained within consolidated output
Single Item Multiple Units, SIMU, system eliminated
Checks in place to flag dropped items and/or demand: quick identification of potential gaps
Sep ‘22
Jan ‘23
Supply Chain Decision Support
Collaborative sessions had positive impact within a couple months…
8
•
> 40% increase in “green” box representing okay demand & on-hand levels within a couple months
Teams worked on reducing this section
04/25/22
03/14/22
More items in the “green”
Line by line manual review by Cedars-Sinai team to lay a clean foundation
Supply Chain Decision Support
Demand: From manual review of >2,000+ records to ~200 in Jan ‘23!
… And now < 50!!!
9
•
Medline reviews &
responds to “MED Lower:” Records where Medline forecast is lower than CS demand
•
Medline internally corrects misalignments between Medline’s DED & forecast values
•
Meeting cadence reduced to once per Medline month
Initial logic:
Enhanced logic: 118 records further reduced to 60
Supply Chain Decision Support
Team able to increase ~43% from 04/25/22 to > 90% today…
10
04/25/22
More items in the “green”
Supply Chain Decision Support
From ~43% back in 04/22 to > 90%
Once demand is locked, we monitor days on hand, DOH, at PS item level
11
•
We pay special attention to the items where both SUOM and parent item are at zero DOH
•
If these items are “non-impactful” – we work with Medline to ensure 100% unadjusted fill rate
Supply Chain Decision Support
And we track these percentages over time…
12
*For CPFR, we were provided the Parent Account Level Reports, which included the newly added ASC & MDN items on 10/3 and 10/10. CPFR
was then restricted to the “C” level, or Customer Level Report, and the record count went back down.
Supply Chain Decision Support
Because of this, our unadjusted fill rates have been better…
13
•
We currently have industry leading fill rates
•
The teams are still learning & fine-tuning the process –
next phase 4-week forecasts
Supply Chain Decision Support
14
Supply Chain Decision Support
This case study highlights how collaborative planning, forecasting, and replenishment strategies were implemented to improve supply chain performance at Cedars-Sinai. By addressing challenges such as low fill rates and lengthy cycle times caused by the pandemic and global events, a joint mission was undertaken to boost the fill rate above 98%. Through the adoption of innovative demand/supply planning approaches and leveraging CPFR principles, data sharing, and logic integration, significant progress was made in consolidating data outputs and enhancing visibility across supply chain operations.

Download Presentation

Please find below an Image/Link to download the presentation.
The content on the website is provided AS IS for your information and personal use only. It may not be sold, licensed, or shared on other websites without obtaining consent from the author. Download presentation by click this link. If you encounter any issues during the download, it is possible that the publisher has removed the file from their server.
E N D
Presentation Transcript
Collaborative planning, forecasting & replenishment Sep 14, 2023 cedars-sinai.org Supply Chain Decision Support
Our product flow Sources: 2 primary Delivery methods: 3 types Hospital Network 1. Palletized bulk deliveries: Minimal; switched to LUM Key Distributor: Medline Control Room Warehouse Facility PO transmitted to distributor: EDI Other distributors 1. Distributor 2. LUM deliveries Deliveries to Central Issues, CI; Other Locations 3. Parcel deliveries Main Hospital CI replens PAR LOCs CI replens PAR LOCs 2. Direct Buys Supply Chain Decision Support
What wasnt working Pandemic & other global events impacted fill rates & cycle time to serve Fill rate: Killed orders were 4 5x their normal levels Cycle time: Requisition to PO times increased due to supply shortages & transmission delays Item level demand affected by backorders; skewed visibility on usage with prior calculation method Impact on forecast & stocking levels Manual processes time consuming for both Cedars-Sinai & Medline teams Multiple reports for team members to review on both sides Data misalignment causing delays in resolution 3 Supply Chain Decision Support
Our joint mission was to improve unadjusted fill rate performance to > 98% Our mission: Improve unadjusted fill rate performance to > 98% Fill rate % Minimum acceptable level band Our fill rates were below expectations Unadjusted rates fell to below 94% Time Our approach: Jointly drive towards an innovative demand/supply planning approach Leverage Collaborative Planning, Forecasting & Replenishment, CPFR Originally CFAR, Collaborative Forecasting & Replenishment, started in retail ~1995 4 Supply Chain Decision Support
We started by sharing data & logic. Huge win! 9* separate data outputs consolidated into 1! Demand reports calibrated against PO history Stock levels: within all our locations DATA DATA Product risk ratings: Internal & Medline # Medline Report Name 1 Material Branch Usage 2 Proactive Backorder Report 3 Active DED Report 4 Allocation Report * 4 from Medline; 5 from Cedars-Sinai 5 Supply Chain Decision Support
Developed automated workflow: reduced manual look-ups; consolidated view Developed an automated workflow to generate consolidated file for review Discussed logic for calculations Questioned items that didn t make sense Adopted weekly auto file transfers Weekly auto outputs Exceptions reviewed as team 6 Supply Chain Decision Support
CPFR*: Jointly driving toward an innovative demand/supply planning approach Decreased time in weekly calls by ~3 hours, using a consolidated planning report Sep 22 Review calls currently < 20 minutes long; switched to a bi-weekly schedule recently Jan 23 Current: ~30 minutes per Medline month Created a brain-trust for optimized patient care demand/supply planning Automated workflow; consolidated output; fine-tuning in progress Increased visibility around stock levels & subs within network Subs info contained within consolidated output Single Item Multiple Units, SIMU, system eliminated Checks in place to flag dropped items and/or demand: quick identification of potential gaps *CPFR = Collaborative Planning, Forecasting & Replenishment 7 Supply Chain Decision Support
Collaborative sessions had positive impact within a couple months > 40% increase in green box representing okay demand & on-hand levels within a couple months Line by line manual review by Cedars-Sinai team to lay a clean foundation 03/14/22 04/25/22 More items in the green Teams worked on reducing this section On-hand Stock Low OH, <= 15 days On-hand Stock Low OH, <= 15 days Okay OH, > 15 days Okay OH, > 15 days Low DED Low DED 159 Items ~4% of total 315 Items ~9% of total 1,001 Items ~32% of total 3 Items ~0.1% of total Forecast Level Forecast Level Okay DED Okay DED 1,607 Items ~44% of total 1,560 Items ~43% of total 2,107 Items ~68% of total 5 Items ~0.2% of total 8 Supply Chain Decision Support
Demand: From manual review of >2,000+ records to ~200 in Jan 23! And now < 50!!! Medline reviews & responds to MED Lower: Records where Medline forecast is lower than CS demand Medline internally corrects misalignments between Medline s DED & forecast values Meeting cadence reduced to once per Medline month Initial logic: Enhanced logic: 118 records further reduced to 60 Flag Review not required Medline: DED & Forecast misaligned Medline: Forecast higher than CS demand Medline: Forecast lower than CS demand Grand Total Record Count Subset for review Flag Review not required Medline: DED & Forecast misaligned Medline: Forecast higher than CS demand Medline: Forecast lower than CS demand Grand Total Record Count 1670 537 369 118 2694 0 1,670 537 369 118 2,694 188 153 60 401 9 Supply Chain Decision Support
Team able to increase ~43% from 04/25/22 to > 90% today 04/25/22 More items in the green From ~43% back in 04/22 to > 90% On-hand Stock Low OH, <= 15 days Okay OH, > 15 days 100% 95% 90% 90% Low DED 80% 159 Items ~4% of total 315 Items ~9% of total 84% 84% 83% 79% 78% 70% Forecast Level 60% 50% Okay DED 40% 1,607 Items ~44% of total 1,560 Items ~43% of total 30% 20% 93% 95% 95% 95% 93% 10% 0% 07/24/23 07/31/23 08/08/23 08/14/23 08/21/23 No Review Required % % Alignment Target % Stretch Target % 10 Supply Chain Decision Support
Once demand is locked, we monitor days on hand, DOH, at PS item level We pay special attention to the items where both SUOM and parent item are at zero DOH If these items are non-impactful we work with Medline to ensure 100% unadjusted fill rate Est. Rialto OH Days: Item Counts 1,324, 52% 1,400 1,200 879 1,000 800 600 349 400 199 134, 10% 137 106 95 200 81 69 50 45 44 43 43 39 38 38 36 31 28 27 27 8 0 = 0 > 0 & < 5 >= 5 & < 10 >= 10 & < 15 >= 15 & < 20 >= 20 & < 25 >= 25 & < 30 >= 30 & < 35 >= 35 & < 40 >= 40 & < 45 >= 45 & < 50 >= 50 SUOM Parent 11 Supply Chain Decision Support
And we track these percentages over time Est. Rialto OH Days = 0 : Item Counts (%) 61%*64%* 70% 55% 55% 54% 53% 54% 53% 54% 53% 54% 54% 54% 54% 54% 53% 54% 60% 50% 40% 30% 15%17%16%17%*16%*16%17% 16%18% 18%19% 20%17% 18%16% 15% 14% 20% 10% 0% SUOM Parent *For CPFR, we were provided the Parent Account Level Reports, which included the newly added ASC & MDN items on 10/3 and 10/10. CPFR was then restricted to the C level, or Customer Level Report, and the record count went back down. 12 Supply Chain Decision Support
Because of this, our unadjusted fill rates have been better We currently have industry leading fill rates The teams are still learning & fine-tuning the process next phase 4-week forecasts 13 Supply Chain Decision Support
14 Supply Chain Decision Support