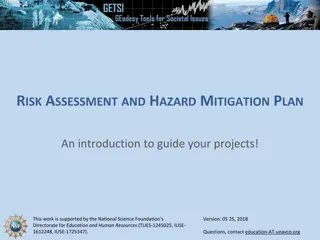
Combining Natural Hazards with Societal Issues: Unit 1 Hazard Map Template
Delve into Unit 1 of the Hazard Map Template, identifying and locating regions susceptible to hazards by choosing top hazards in the mapping area. Create hazard maps, combine shapes, and include a key and sources for a comprehensive view of potential hazards and vulnerabilities.

Uploaded on Sep 27, 2024 | 0 Views
Download Presentation

Please find below an Image/Link to download the presentation.
The content on the website is provided AS IS for your information and personal use only. It may not be sold, licensed, or shared on other websites without obtaining consent from the author. Download presentation by click this link. If you encounter any issues during the download, it is possible that the publisher has removed the file from their server.
E N D
Presentation Transcript
Hazard Map Template Unit 1 Map Your Hazards! Combining Natural Hazards with Societal Issues
Title: Authors:
Unit 1 Hazard Map Identify and locate regions within the map that are susceptible to hazards. Choose three top hazards in your mapping area (you can include more if you would like). Use one map (slide) per hazard. Label the slide with the hazard. Draw shaded (but 60% transparent) shapes around the hazard area in each map (use a different color for each hazard). Combine hazard shapes (copy and paste) onto a single map slide (make sure to align the shapes properly), and include a key and cite sources.
Key Hazard 1: Hazard 2: Hazard 3: Combined Hazard Map
Citations Sources for Hazard 1 shapes: Sources for Hazard 2 shapes: Sources for Hazard 3 shapes:
Key Major Transportation routes: Major Bridges: Hospitals: Retirement homes: Schools: Low income areas (cite source): Additional vulnerabilities (cite source): Map for Vulnerabilities
Key Hazard 1: Hazard 2: Hazard 3: Major Transportation routes: Major Bridges: Hospitals: Retirement homes: Schools: Low income areas (cite source): Additional vulnerabilities: Combined Hazards and Vulnerabilities Map
Key Very high risk: maroon High risk: red Moderate risk: orange Low risk: yellow Risk Level Map