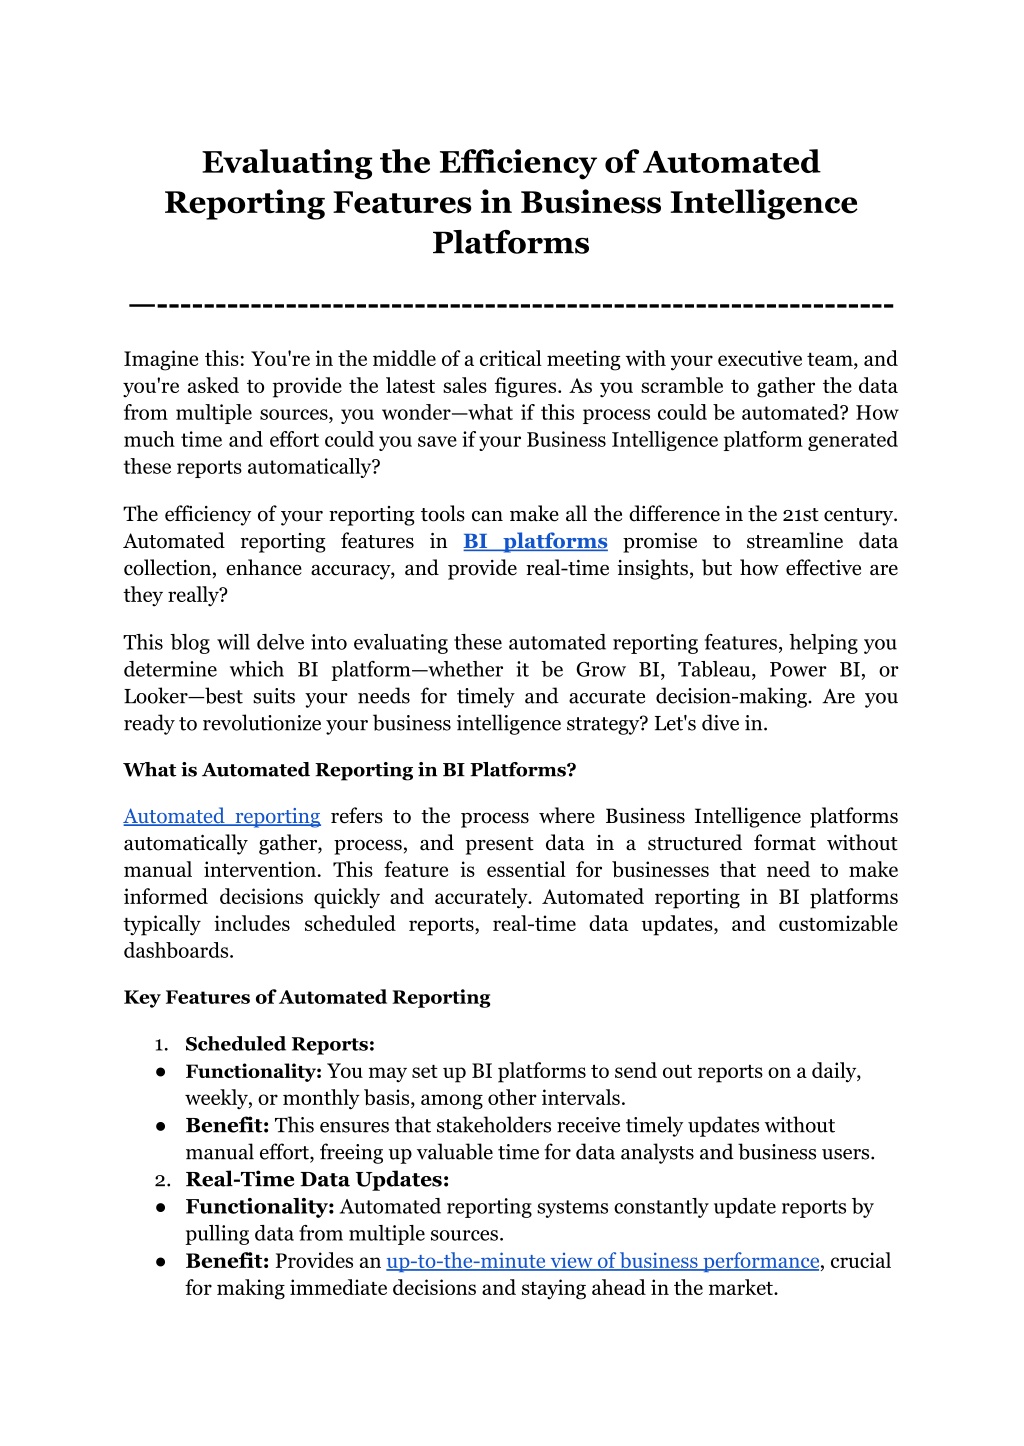
Evaluating the Efficiency of Automated Reporting Features in Business Intelligence Platforms
We evaluate the efficiency of automated reporting features in leading Business Intelligence platforms such as Grow BI, Tableau, Power BI, and Looker. Discover how these tools can streamline data collection, enhance accuracy, and provide real-time insights to drive informed decision-making.
Download Presentation

Please find below an Image/Link to download the presentation.
The content on the website is provided AS IS for your information and personal use only. It may not be sold, licensed, or shared on other websites without obtaining consent from the author. Download presentation by click this link. If you encounter any issues during the download, it is possible that the publisher has removed the file from their server.
E N D
Presentation Transcript
Evaluating the Efficiency of Automated Reporting Features in Business Intelligence Platforms --------------------------------------------------------------- Imagine this: You're in the middle of a critical meeting with your executive team, and you're asked to provide the latest sales figures. As you scramble to gather the data from multiple sources, you wonder what if this process could be automated? How much time and effort could you save if your Business Intelligence platform generated these reports automatically? The efficiency of your reporting tools can make all the difference in the 21st century. Automated reporting features in BI platforms promise to streamline data collection, enhance accuracy, and provide real-time insights, but how effective are they really? This blog will delve into evaluating these automated reporting features, helping you determine which BI platform whether it be Grow BI, Tableau, Power BI, or Looker best suits your needs for timely and accurate decision-making. Are you ready to revolutionize your business intelligence strategy? Let's dive in. What is Automated Reporting in BI Platforms? Automated reporting refers to the process where Business Intelligence platforms automatically gather, process, and present data in a structured format without manual intervention. This feature is essential for businesses that need to make informed decisions quickly and accurately. Automated reporting in BI platforms typically includes scheduled reports, real-time data updates, and customizable dashboards. Key Features of Automated Reporting 1. Scheduled Reports: Functionality: You may set up BI platforms to send out reports on a daily, weekly, or monthly basis, among other intervals. Benefit: This ensures that stakeholders receive timely updates without manual effort, freeing up valuable time for data analysts and business users. 2. Real-Time Data Updates: Functionality: Automated reporting systems constantly update reports by pulling data from multiple sources. Benefit: Provides an up-to-the-minute view of business performance, crucial for making immediate decisions and staying ahead in the market.
3. Customizable Dashboards: Functionality: Efficiently working BI platforms allow users to create tailored dashboards that focus on specific metrics and KPIs relevant to their role or department. Benefit: Enables a more personalized and relevant data experience, enhancing the overall utility and effectiveness of the Business Intelligence platform. Benefits of Automated Reporting in BI Platforms 1. Time Efficiency: Automated reporting drastically reduces the time spent on data collection and report generation. Business Intelligence platforms streamline these processes, allowing data analysts to focus on interpreting data rather than compiling it. 2. Enhanced Accuracy and Consistency: By minimizing human intervention, automated reporting reduces the risk of errors. BI platforms ensure that reports are consistently accurate, which is vital for maintaining data integrity and making reliable business decisions. 3. Real-Time Insights: With real-time data updates, BI platforms provide businesses with the ability to react promptly to changes and opportunities. Decisions made at the last minute can have a devastating effect on a company's success in the fast-paced economy. Evaluating the Efficiency of Automated Reporting Features Key Metrics for Evaluating Efficiency To effectively evaluate the efficiency of automated reporting features in a Business Intelligence platform, consider the following metrics: 1. Time Saved on Report Generation: Metric: Measure the reduction in time spent on manual data collection and report generation. Evaluation: A working BI platform with efficient automated reporting should significantly decrease the time required to produce reports, allowing analysts to focus on data interpretation and strategic analysis. 2. Accuracy and Consistency: Metric: Assess the accuracy and consistency of the reports generated. Evaluation: Automated reporting should minimize human errors and ensure that data is consistently accurate across different reports. BI platforms should be able to pull data from multiple sources and present it uniformly. 3. Real-Time Data Updates: Metric: Evaluate the ability of the platform to provide real-time data updates. 2
Evaluation: Real-time insights are crucial for making timely decisions. Business Intelligence platforms should offer real-time data processing capabilities, ensuring that users always have access to the most current information. 4. User Satisfaction and Ease of Use: Metric: Collect feedback from users regarding their experience with the automated reporting features. Evaluation: User satisfaction is a critical indicator of efficiency. BI platforms should be user-friendly, with intuitive interfaces that make automated reporting accessible to all users, regardless of their technical proficiency. Key Metrics for Comparison To effectively evaluate the efficiency of automated reporting features in a Business Intelligence platform, consider the following metrics: 1. Time Efficiency 2. Accuracy and Consistency 3. Real-Time Data Updates 4. User Satisfaction and Ease of Use 5. Customization and Flexibility Grow BI Overview: Grow BI is renowned for its user-friendly interface and robust automated reporting capabilities, making it a popular choice among small to mid-sized businesses. Time Efficiency: Grow BI offers extensive automation for report generation, significantly reducing the time required for data collection and processing. Reports can be scheduled at various intervals (e.g., daily, weekly, monthly), ensuring timely delivery without manual intervention. The platform's integration with various data sources enables seamless data aggregation, enhancing overall productivity. Accuracy and Consistency: Grow BI ensures high accuracy and consistency by minimizing human error through automated processes. The platform supports data validation rules and error-checking algorithms to maintain data integrity. It also provides version control for reports, ensuring that users always have access to the most up-to-date information. Real-Time Data Updates: Grow BI excels in providing real-time data updates, allowing users to make informed decisions based on the latest information. The platform supports live data connections to various databases, cloud services, and APIs, ensuring that reports reflect real-time changes in data. This feature is particularly beneficial for dynamic business environments where timely decisions are critical. 3
User Satisfaction and Ease of Use: Grow BI scores high on user satisfaction due to its intuitive interface and ease of use. The platform offers drag-and-drop functionality for report creation, making it accessible even to non-technical users. Additionally, Grow BI provides comprehensive support resources, including tutorials, documentation, and customer service, to assist users in maximizing the platform's capabilities. Customization and Flexibility: Grow BI offers extensive customization options, enabling users to tailor reports and dashboards to fit their unique requirements. The platform supports custom formulas, calculated fields, and conditional formatting, allowing users to create highly personalized reports. Its flexibility in integrating with other business applications, such as CRM and ERP systems, further enhances its utility. Pricing: Grow BI offers tiered pricing plans based on the number of users and data connections. Prospective buyers should consider their specific reporting needs, the volume of data, and the level of customization required when selecting a plan. Grow BI also provides a 14-day free trial, allowing potential users to evaluate the platform before committing to a subscription. Tableau Overview: Tableau is a leading BI platform known for its powerful data visualization capabilities and robust analytics. It is widely used by enterprises for its advanced reporting and analytical features. Time Efficiency: Tableau s automated reporting features are designed to streamline report generation, though its complexity might require a steeper learning curve compared to Grow BI. The platform supports the scheduling of reports and dashboards, automating data refreshes, and ensuring that users have access to the latest data without manual intervention. Accuracy and Consistency: Tableau ensures high levels of accuracy and consistency in its reports, thanks to its advanced data processing algorithms and robust integration capabilities. The platform supports data blending from multiple sources, ensuring that reports are comprehensive and accurate. Tableau also provides tools for data cleaning and transformation, enhancing data quality. Real-Time Data Updates: Tableau provides real-time data updates through its live data connection feature. Users can connect Tableau to live databases, cloud services, and APIs to ensure that their dashboards and reports reflect the most current data. This capability is particularly useful for businesses that require up-to-the-minute insights. User Satisfaction and Ease of Use: While Tableau is highly powerful, its complexity can be a barrier for some users. However, those who invest time in 4
learning the platform often find it highly rewarding. Tableau offers extensive training resources, including online courses, webinars, and user forums, to help users become proficient in using the platform. Customization and Flexibility: Tableau offers a high degree of customization, allowing users to create tailored reports and dashboards. The platform supports custom calculations, scripting, and advanced visualizations, providing users with the flexibility to create highly detailed and specific reports. Its integration capabilities are among the best in the market, making it a versatile choice for many businesses. Pricing: Tableau offers various licensing options, including individual, team, and enterprise plans. Prospective buyers should consider the scale of their operations and the complexity of their reporting needs when selecting a plan. Tableau also offers a free trial and discounts for educational institutions and non-profit organizations. Power BI Overview: Microsoft Power BI is a robust Business Intelligence platform favored for its seamless integration with other Microsoft products and services. It is known for its affordability and user-friendly interface. Time Efficiency: Power BI s automated reporting features are highly efficient, reducing the time spent on manual report generation. The platform supports scheduled data refreshes and automated report delivery, ensuring that users receive timely updates without manual effort. Its integration with Microsoft s ecosystem, such as Excel and Azure, further streamlines data workflows. Accuracy and Consistency: Power BI ensures accurate and consistent reporting through its automated data processing capabilities. The platform s integration with Azure and other Microsoft services enhances data reliability. Power BI also offers data quality services, such as data cleansing and transformation tools, to maintain data integrity. Real-Time Data Updates: Power BI offers real-time data updates, though the frequency and granularity of updates can depend on the data source and configuration. The platform supports streaming data from various sources, allowing users to build real-time dashboards that display live data. User Satisfaction and Ease of Use: Power BI is generally well-received for its user-friendly interface, especially for those already familiar with Microsoft products. Its drag-and-drop functionality makes it accessible to a wide range of users. Power BI provides extensive support resources, including guided learning paths, community forums, and dedicated customer support. Customization and Flexibility: Power BI provides robust customization options, allowing users to tailor their reports and dashboards extensively. The platform 5
supports custom visuals, DAX (Data Analysis Expressions) for advanced calculations, and R and Python integration for advanced analytics. Its integration with other Microsoft tools adds to its flexibility and appeal. Pricing: Power BI offers both free and paid versions, with the paid version (Power BI Pro) providing additional features and capabilities. Organizations can also opt for Power BI Premium for larger-scale deployments and enhanced performance. Prospective buyers should evaluate their specific needs and budget when selecting a plan. Looker Overview: Looker is a cloud-based working BI platform known for its powerful data modeling and exploration capabilities. It is designed to help businesses create a single source of truth for their data. Time Efficiency: Looker s automated reporting features are efficient, though the platform s advanced capabilities may require a more technical understanding compared to others like Grow BI. The platform supports scheduled data extraction and report delivery, automating routine reporting tasks and reducing manual effort. Accuracy and Consistency: Looker ensures high accuracy and consistency through its advanced data modeling features, which allow for detailed and precise reporting. The platform s LookML language enables users to define complex data relationships and calculations, ensuring that reports are both accurate and comprehensive. Real-Time Data Updates: Looker excels in providing real-time data updates, making it suitable for businesses that need up-to-the-minute insights. The platform supports live connections to various data sources, ensuring that reports and dashboards always reflect the latest data. User Satisfaction and Ease of Use: Looker is favored by users for its powerful capabilities, though it can be complex for non-technical users. However, its detailed documentation and support resources help mitigate this challenge. Looker also offers training programs and certifications to help users become proficient in using the platform. Customization and Flexibility: Looker offers extensive customization and flexibility, particularly in its data modeling and exploration features. The platform supports custom dashboards, advanced visualizations, and integration with various data sources. Looker s API capabilities also allow for extensive customization and integration with other business applications. Pricing: Looker offers a flexible pricing model based on the number of users and the complexity of the deployment. Prospective buyers should consider their specific 6
reporting needs and the level of customization required when selecting a plan. Looker also provides a free trial, allowing potential users to evaluate the platform before making a commitment. Conclusion Evaluating the efficiency of automated reporting features in Business Intelligence platforms is crucial for businesses looking to enhance their data-driven decision-making processes. By comparing leading BI platforms such as Grow BI, Tableau, Power BI, and Looker, we can see that each platform offers unique strengths tailored to different business needs. Grow BI stands out for its user-friendly interface, extensive customization options, and real-time data capabilities, making it an excellent choice for small to mid-sized businesses aiming for efficiency and accuracy. For those interested in exploring how Grow BI can transform their reporting processes, consider taking advantage of Grow demo to experience its features firsthand. Additionally, check out "Grow Features & Capabilities GetApp" for a detailed overview of what Grow BI offers. Start your journey towards more efficient and accurate reporting with Grow BI today. 7


