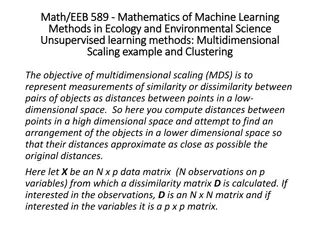
Understanding Data Structures in High-Dimensional Space
Explore the concept of clustering data points in high-dimensional spaces with distance measures like Euclidean, Cosine, Jaccard, and edit distance. Discover the challenges of clustering in dimensions beyond 2 and the importance of similarity in grouping objects. Dive into applications such as cataloging sky objects based on radiation frequencies in 7 dimensions. These insights are from the book "Mining of Massive Datasets" by J. Leskovec, A. Rajaraman, and J. Ullman.

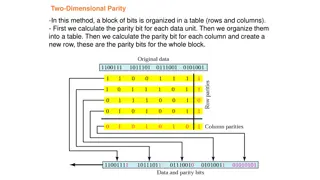
Uploaded on Sep 21, 2024 | 0 Views
Download Presentation

Please find below an Image/Link to download the presentation.
The content on the website is provided AS IS for your information and personal use only. It may not be sold, licensed, or shared on other websites without obtaining consent from the author. Download presentation by click this link. If you encounter any issues during the download, it is possible that the publisher has removed the file from their server.
E N D
Presentation Transcript
Note to other teachers and users of these slides: We would be delighted if you found this our material useful in giving your own lectures. Feel free to use these slides verbatim, or to modify them to fit your own needs. If you make use of a significant portion of these slides in your own lecture, please include this message, or a link to our web site: http://www.mmds.org Mining of Massive Datasets Jure Leskovec, Anand Rajaraman, Jeff Ullman Stanford University http://www.mmds.org
Given a cloud of data points we want to understand its structure J. Leskovec, A. Rajaraman, J. Ullman: Mining of Massive Datasets, http://www.mmds.org 2
Given a set of points, with a notion of distance between points, group the points into some number of clusters, so that Members of a cluster are close/similar to each other Members of different clusters are dissimilar Usually: Points are in a high-dimensional space Similarity is defined using a distance measure Euclidean, Cosine, Jaccard, edit distance, J. Leskovec, A. Rajaraman, J. Ullman: Mining of Massive Datasets, http://www.mmds.org 3
x x x xx x x x x x x x x x x x x xx x x x x x x x x x x x x x x x x x x x x x x x x x x x x x x x x x x x x x x x x x x x x x x x x x x x x x x x x x x x x x Cluster Outlier J. Leskovec, A. Rajaraman, J. Ullman: Mining of Massive Datasets, http://www.mmds.org 4
J. Leskovec, A. Rajaraman, J. Ullman: Mining of Massive Datasets, http://www.mmds.org 5
Clustering in two dimensions looks easy Clustering small amounts of data looks easy And in most cases, looks are not deceiving Many applications involve not 2, but 10 or 10,000 dimensions High-dimensional spaces look different: Almost all pairs of points are at about the same distance J. Leskovec, A. Rajaraman, J. Ullman: Mining of Massive Datasets, http://www.mmds.org 6
A catalog of 2 billion sky objects represents objects by their radiation in 7 dimensions (frequency bands) Problem:Cluster into similar objects, e.g., galaxies, nearby stars, quasars, etc. Sloan Digital Sky Survey J. Leskovec, A. Rajaraman, J. Ullman: Mining of Massive Datasets, http://www.mmds.org 7
Intuitively:Music divides into categories, and customers prefer a few categories But what are categories really? Represent a CD by a set of customers who bought it: Similar CDs have similar sets of customers, and vice-versa J. Leskovec, A. Rajaraman, J. Ullman: Mining of Massive Datasets, http://www.mmds.org 8
Space of all CDs: Think of a space with one dim. for each customer Values in a dimension may be 0 or 1 only A CD is a point in this space (x1, x2, , xk), where xi = 1 iff the i th customer bought the CD For Amazon, the dimension is tens of millions Task: Find clusters of similar CDs J. Leskovec, A. Rajaraman, J. Ullman: Mining of Massive Datasets, http://www.mmds.org 9
Finding topics: Represent a document by a vector (x1, x2, , xk), where xi = 1 iff the i th word (in some order) appears in the document It actually doesn t matter if k is infinite; i.e., we don t limit the set of words Documents with similar sets of words may be about the same topic J. Leskovec, A. Rajaraman, J. Ullman: Mining of Massive Datasets, http://www.mmds.org 10
As with CDs we have a choice when we think of documents as sets of words or shingles: Sets as vectors: Measure similarity by the cosine distance Sets as sets: Measure similarity by the Jaccard distance Sets as points: Measure similarity by Euclidean distance J. Leskovec, A. Rajaraman, J. Ullman: Mining of Massive Datasets, http://www.mmds.org 11
Hierarchical: Agglomerative (bottom up): Initially, each point is a cluster Repeatedly combine the two nearest clusters into one Divisive (top down): Start with one cluster and recursively split it Point assignment: Maintain a set of clusters Points belong to nearest cluster J. Leskovec, A. Rajaraman, J. Ullman: Mining of Massive Datasets, http://www.mmds.org 12
Key operation: Repeatedly combine two nearest clusters Three important questions: 1) How do you represent a cluster of more than one point? 2)How do you determine the nearness of clusters? 3) When to stop combining clusters? J. Leskovec, A. Rajaraman, J. Ullman: Mining of Massive Datasets, http://www.mmds.org 13
Key operation: Repeatedly combine two nearest clusters (1) How to represent a cluster of many points? Key problem: As you merge clusters, how do you represent the location of each cluster, to tell which pair of clusters is closest? Euclidean case: each cluster has a centroid = average of its (data)points (2) How to determine nearness of clusters? Measure cluster distances by distances of centroids J. Leskovec, A. Rajaraman, J. Ullman: Mining of Massive Datasets, http://www.mmds.org 14
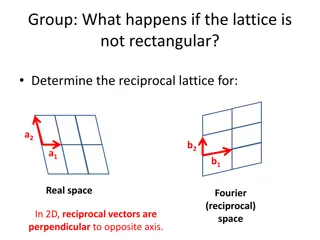
(5,3) o (1,2) o x (1.5,1.5) x (1,1) x (4.7,1.3) o (2,1) o (4,1) x (4.5,0.5) o (0,0) o (5,0) Data: o data point x centroid Dendrogram J. Leskovec, A. Rajaraman, J. Ullman: Mining of Massive Datasets, http://www.mmds.org 15
What about the Non-Euclidean case? The only locations we can talk about are the points themselves i.e., there is no average of two points Approach 1: (1) How to represent a cluster of many points? clustroid = (data)point closest to other points (2) How do you determine the nearness of clusters? Treat clustroid as if it were centroid, when computing inter-cluster distances J. Leskovec, A. Rajaraman, J. Ullman: Mining of Massive Datasets, http://www.mmds.org 16
(1) How to represent a cluster of many points? clustroid= point closest to other points Possible meanings of closest : Smallest maximum distance to other points Smallest average distance to other points Smallest sum of squares of distances to other points For distance metric d clustroid c of cluster C is: Centroid Datapoint C x 2) min ( , d x c c Centroid is the avg. of all (data)points in the cluster. This means centroid is an artificial point. Clustroid is an existing (data)point that is closest to all other points in the cluster. X Clustroid Cluster on 3 datapoints J. Leskovec, A. Rajaraman, J. Ullman: Mining of Massive Datasets, http://www.mmds.org 17
(2) How do you determine the nearness of clusters? Approach 2: Intercluster distance = minimum of the distances between any two points, one from each cluster Approach 3: Pick a notion of cohesion of clusters, e.g., maximum distance from the clustroid Merge clusters whose union is most cohesive J. Leskovec, A. Rajaraman, J. Ullman: Mining of Massive Datasets, http://www.mmds.org 18
Approach 3.1: Use the diameter of the merged cluster = maximum distance between points in the cluster Approach 3.2: Use the average distance between points in the cluster Approach 3.3: Use a density-based approach Take the diameter or avg. distance, e.g., and divide by the number of points in the cluster J. Leskovec, A. Rajaraman, J. Ullman: Mining of Massive Datasets, http://www.mmds.org 19
Nave implementation of hierarchical clustering: At each step, compute pairwise distances between all pairs of clusters, then merge O(N3) Careful implementation using priority queue can reduce time to O(N2 log N) Still too expensive for really big datasets that do not fit in memory J. Leskovec, A. Rajaraman, J. Ullman: Mining of Massive Datasets, http://www.mmds.org 20
Assumes Euclidean space/distance Start by picking k, the number of clusters Initialize clusters by picking one point per cluster Example: Pick one point at random, then k-1 other points, each as far away as possible from the previous points J. Leskovec, A. Rajaraman, J. Ullman: Mining of Massive Datasets, http://www.mmds.org 22
1) For each point, place it in the cluster whose current centroid it is nearest 2) After all points are assigned, update the locations of centroids of the k clusters 3) Reassign all points to their closest centroid Sometimes moves points between clusters Repeat 2 and 3 until convergence Convergence:Points don t move between clusters and centroids stabilize J. Leskovec, A. Rajaraman, J. Ullman: Mining of Massive Datasets, http://www.mmds.org 23
x x x x x x x x x x x x data point centroid Clusters after round 1 J. Leskovec, A. Rajaraman, J. Ullman: Mining of Massive Datasets, http://www.mmds.org 24
x x x x x x x x x x x x data point centroid Clusters after round 2 J. Leskovec, A. Rajaraman, J. Ullman: Mining of Massive Datasets, http://www.mmds.org 25
x x x x x x x x x x x x data point centroid Clusters at the end J. Leskovec, A. Rajaraman, J. Ullman: Mining of Massive Datasets, http://www.mmds.org 26
How to select k? Try different k, looking at the change in the average distance to centroid as k increases Average falls rapidly until right k, then changes little Best value of k Average distance to centroid k J. Leskovec, A. Rajaraman, J. Ullman: Mining of Massive Datasets, http://www.mmds.org 27
Too few; many long distances to centroid. x x xx x x x x x x x x x x x x x x x x x x x x x x x x x x x x x x x x x x x x x J. Leskovec, A. Rajaraman, J. Ullman: Mining of Massive Datasets, http://www.mmds.org 28
x Just right; distances rather short. x xx x x x x x x x x x x x x x x x x x x x x x x x x x x x x x x x x x x x x x J. Leskovec, A. Rajaraman, J. Ullman: Mining of Massive Datasets, http://www.mmds.org 29
Too many; little improvement in average distance. x x xx x x x x x x x x x x x x x x x x x x x x x x x x x x x x x x x x x x x x x J. Leskovec, A. Rajaraman, J. Ullman: Mining of Massive Datasets, http://www.mmds.org 30
BFR [Bradley-Fayyad-Reina] is a variant of k-means designed to handle very large (disk-resident) data sets Assumes that clusters are normally distributed around a centroid in a Euclidean space Standard deviations in different dimensions may vary Clusters are axis-aligned ellipses Efficient way to summarize clusters (required memory O(clusters) and not O(data)) J. Leskovec, A. Rajaraman, J. Ullman: Mining of Massive Datasets, http://www.mmds.org 32
Points are read from disk one main-memory- full at a time Most points from previous memory loads are summarized by simple statistics To begin, from the initial load we select the initial k centroids by some sensible approach: Take k random points Take a small random sample and cluster optimally Take a sample; pick a random point, and then k 1 more points, each as far from the previously selected points as possible J. Leskovec, A. Rajaraman, J. Ullman: Mining of Massive Datasets, http://www.mmds.org 33
3 sets of points which we keep track of: Discard set (DS): Points close enough to a centroid to be summarized Compression set (CS): Groups of points that are close together but not close to any existing centroid These points are summarized, but not assigned to a cluster Retained set (RS): Isolated points waiting to be assigned to a compression set J. Leskovec, A. Rajaraman, J. Ullman: Mining of Massive Datasets, http://www.mmds.org 34
Points in the RS Compressed sets. Their points are in the CS. A cluster. Its points are in the DS. The centroid Discard set (DS): Close enough to a centroid to be summarized Compression set (CS): Summarized, but not assigned to a cluster Retained set (RS): Isolated points J. Leskovec, A. Rajaraman, J. Ullman: Mining of Massive Datasets, http://www.mmds.org 35
For each cluster, the discard set (DS) is summarized by: The number of points, N The vector SUM, whose ith component is the sum of the coordinates of the points in the ith dimension The vector SUMSQ: ith component = sum of squares of coordinates in ith dimension A cluster. All its points are in the DS. The centroid J. Leskovec, A. Rajaraman, J. Ullman: Mining of Massive Datasets, http://www.mmds.org 36
2d + 1 values represent any size cluster d = number of dimensions Average in each dimension (the centroid) can be calculated as SUMi/ N SUMi = ith component of SUM Variance of a cluster s discard set in dimension i is: (SUMSQi / N) (SUMi / N)2 And standard deviation is the square root of that Next step: Actual clustering Note:Dropping the axis-aligned clusters assumption would require storing full covariance matrix to summarize the cluster. So, instead of SUMSQ being a d-dim vector, it would be a dx d matrix, which is too big! J. Leskovec, A. Rajaraman, J. Ullman: Mining of Massive Datasets, http://www.mmds.org 37
Processing the Memory-Load of points (1): 1) Find those points that are sufficiently close to a cluster centroid and add those points to that cluster and the DS These points are so close to the centroid that they can be summarized and then discarded 2) Use any main-memory clustering algorithm to cluster the remaining points and the old RS Clusters go to the CS; outlying points to the RS Discard set (DS): Close enough to a centroid to be summarized. Compression set (CS): Summarized, but not assigned to a cluster Retained set (RS): Isolated points J. Leskovec, A. Rajaraman, J. Ullman: Mining of Massive Datasets, http://www.mmds.org 38
Processing the Memory-Load of points (2): 3) DS set: Adjust statistics of the clusters to account for the new points Add Ns, SUMs, SUMSQs 4) Consider merging compressed sets in the CS 5) If this is the last round, merge all compressed sets in the CS and all RS points into their nearest cluster Discard set (DS): Close enough to a centroid to be summarized. Compression set (CS): Summarized, but not assigned to a cluster Retained set (RS): Isolated points J. Leskovec, A. Rajaraman, J. Ullman: Mining of Massive Datasets, http://www.mmds.org 39
Points in the RS Compressed sets. Their points are in the CS. A cluster. Its points are in the DS. The centroid Discard set (DS): Close enough to a centroid to be summarized Compression set (CS): Summarized, but not assigned to a cluster Retained set (RS): Isolated points J. Leskovec, A. Rajaraman, J. Ullman: Mining of Massive Datasets, http://www.mmds.org 40
Q1) How do we decide if a point is close enough to a cluster that we will add the point to that cluster? Q2) How do we decide whether two compressed sets (CS) deserve to be combined into one? J. Leskovec, A. Rajaraman, J. Ullman: Mining of Massive Datasets, http://www.mmds.org 41
Q1) We need a way to decide whether to put a new point into a cluster (and discard) BFR suggests two ways: The Mahalanobis distance is less than a threshold High likelihood of the point belonging to currently nearest centroid J. Leskovec, A. Rajaraman, J. Ullman: Mining of Massive Datasets, http://www.mmds.org 42
Normalized Euclidean distance from centroid For point (x1, , xd) and centroid (c1, , cd) 1. Normalize in each dimension: yi = (xi - ci) / i 2. Take sum of the squares of theyi 3. Take the square root 2 ? ?? ?? ?? ? ?,? = ?=1 i standard deviation of points in the cluster in the ith dimension J. Leskovec, A. Rajaraman, J. Ullman: Mining of Massive Datasets, http://www.mmds.org 43
If clusters are normally distributed in d dimensions, then after transformation, one standard deviation = ? i.e., 68% of the points of the cluster will have a Mahalanobis distance < ? Accept a point for a cluster if its M.D. is < some threshold, e.g. 2 standard deviations J. Leskovec, A. Rajaraman, J. Ullman: Mining of Massive Datasets, http://www.mmds.org 44
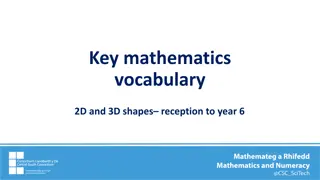
Euclidean vs. Mahalanobis distance Contours of equidistant points from the origin Uniformly distributed points, Euclidean distance Normally distributed points, Euclidean distance Normally distributed points, Mahalanobis distance J. Leskovec, A. Rajaraman, J. Ullman: Mining of Massive Datasets, http://www.mmds.org 45
Q2) Should 2 CS subclusters be combined? Compute the variance of the combined subcluster N, SUM, and SUMSQallow us to make that calculation quickly Combine if the combined variance is below some threshold Many alternatives: Treat dimensions differently, consider density J. Leskovec, A. Rajaraman, J. Ullman: Mining of Massive Datasets, http://www.mmds.org 46
Extension of k-means to clusters of arbitrary shapes
Vs. Problem with BFR/k-means: Assumes clusters are normally distributed in each dimension And axes are fixed ellipses at an angle are not OK CURE (Clustering Using REpresentatives): Assumes an Euclidean distance Allows clusters to assume any shape Uses a collection of representative points to represent clusters J. Leskovec, A. Rajaraman, J. Ullman: Mining of Massive Datasets, http://www.mmds.org 48
h h h e e e h e e e h e e e e h salary e h h h h h h h age J. Leskovec, A. Rajaraman, J. Ullman: Mining of Massive Datasets, http://www.mmds.org 49
2 Pass algorithm. Pass 1: 0) Pick a random sample of points that fit in main memory 1) Initial clusters: Cluster these points hierarchically group nearest points/clusters 2) Pick representative points: For each cluster, pick a sample of points, as dispersed as possible From the sample, pick representatives by moving them (say) 20% toward the centroid of the cluster J. Leskovec, A. Rajaraman, J. Ullman: Mining of Massive Datasets, http://www.mmds.org 50


")

 How to represent a cluster of many points?")
 How do you determine the “nearness” of")


 For each point, place it in the cluster whose")


 is")

:")
:")

 How do we decide if a point is “close")
 We need a way to decide whether to put")


 Should 2 CS subclusters be combined?")