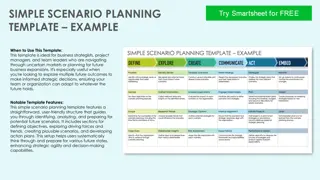
Strategies for Effective Decision Making in Uncertain Business Environments

Panel discussion at the 2016 Annual Meeting of the Decision Sciences Institute focusing on experiences in introducing or expanding analytics offerings in academia. Babson College's robust technology infrastructure and new analytics courses are highlighted.

Download Presentation

Please find below an Image/Link to download the presentation.
The content on the website is provided AS IS for your information and personal use only. It may not be sold, licensed, or shared on other websites without obtaining consent from the author. Download presentation by click this link. If you encounter any issues during the download, it is possible that the publisher has removed the file from their server.
E N D
Presentation Transcript
2016 Annual Meeting of the 2016 Annual Meeting of the Decision Sciences Institute Decision Sciences Institute Effective Decision Making in Uncertain Business Environments: Strategies, Practices, and Techniques November 19th-22nd Austin Texas
DATA, ANALYTICS and STATISTICS INSTRUCTION: Experiences with Introducing or Expanding Analytics Offerings Abstract: Panel members share their experiences with efforts to add or revise curriculum to better prepare students with analytics skills that are in demand by employers. Audience members will be encouraged to participate in this discussion. Robert Andrews, Virginia Commonwealth University, randrews@vcu.edu Kirk Karwan, Furman University, kirk.karwan@furman.edu Kellie Keeling, University of Denver, Kellie.Keeling@du.edu Bill Rybolt, Babson College, rybolt@babson.edu George Recck, Babson College, recck@babson.edu Paolo Catasti, Virginia Commonwealth University, pcatasti@vcu.edu JW Marriott Austin, 2ndFloor, 205 4:30 - 6 PM, Sunday, November 20, 2016
Babson College The Babson College campus has a robust local area network that provides industry-standard software. Wireless networking has been employed in Babson s buildings, including all dorms, the Horn Library, and the Reynolds Campus Center. Many classrooms were networked in the mid to late nineteen nineties. Since the fall of 2000, every first year Babson undergraduate has received a leased laptop computer, currently a Lenovo ThinkPad. Laptops are upgraded every two years as part of the College's Technology Initiative. Students have access to high-level technology and software both in and out of the classroom. All students have Windows, Microsoft Office, Minitab, Tableau, R-Studio, and Excel Miner, Blackboard and access to the Internet. Students and instructors of quantitative methods have access to innovative electronic resources which are used in an interactive environment to build skills, understand concepts, and the assessment of learning outcomes.
Three New Babson Courses in Analytics QTM1000: Quantitative Methods for Business Analytics I QTM1010: Quantitative Methods for Business Analytics II QTM2000: Case Studies in Business Analytics Each course is 4 credits There are 26 classes meeting, each is 95 minutes twice per week Course Sections, Fall 2016 Sections, Spring 2017 QTM1000 Required 16 5 QTM1010 Required 6 14 QTM2000 Elective 6 3
QTM1000: Quantitative Methods for Business Analytics I The course introduces the necessary core quantitative methods that are prerequisites to follow-on courses in QTM and in Babson's integrated core business offerings. Statistical software and the use of spreadsheets are integrated throughout so that students better comprehend the importance of using modern technological tools for effective model building and decision- making. About two thirds of the course is data-oriented, exposing students to basic statistical methods, their conceptual underpinning, such as variability and uncertainty, and their use in the real world. Topics include data collection, descriptive statistics, elementary probability rules and distributions, sampling distributions, and basic inference. The last third of the course is dedicated to selected non-statistical quantitative techniques applied to business models. Topics include curve fitting, differential calculus applications to non-linear optimization, and introduction to the time value of money.
Day Date Tentative Topics Readings Practice Problems Day Date Tentative Topics Readings Practice Problems Two-Sample Hypothesis Tests for the Mean Mon Oct. 17 PLS: 10.1-10.2 PLS: 10.10, 10.20 13 Introduction to Basic Business Statistics and Minitab PLS: 1.1-1.2 & Appendix A Wed Oct. 19 Chi-Square Test of Independence PLS: 11.3 PLS: 11.24, 11.26 14 Wed Aug. 31 PLS: 1.4 1 Breakeven, Cost Functions, and Supply & Demand PLS: 12.1-12.2 (Pg. 429-452) PLS: P. 437, #60, 62 PLS: P. 450, #79, 80 Mon Oct. 24 15 Sep. 5 Labor Day Holiday PLS: 12.3 (Pg. 452-464) Wed Oct. 26 PLS: P. 459, #11, 12, 16 Linear Regression 16 Sampling Methods and Worthiness PLS: 1.3-1.5 PLS: 1.16, 1.24, 1.28 Wed Sep. 7 2 PLS: P. 481, #86, 90 PLS: P. 493, #70, 72 PLS: P. 507, #66, 68, 70 Functions, Graphs, Piecewise and Quadratic Functions PLS: 13.1-13.3 (Pg. 469-506) PLS: 2.1-2.2 PLS: 2.6, 2.16 Organizing Data Mon Oct. 31 17 Statistical Displays (Tables and Graphs) PLS: P. 519, #60, 62 PLS: P. 530, #56, 63 PLS: P. 542, #81, 83, 85 Mon Sep. 12 PLS: 2.3-2.7 PLS: 2.24, 2.30, 2.36, 2.50 Polynomial, Exponential, and Logistic Functions PLS: 13.4-13.6 (Pg. 510-543) 3 Wed Nov. 2 18 Wed Sep. 14 Numerical Descriptive Measures PLS: 3.1-3.5 PLS: 3.10, 3.20, 3.36, 3.42, 3.46 4 PLS: 14.4 (Pg. 590-605) PLS: 14.5 (Pg. 605-614) PLS: P. 603, #80, 84, 88 The Derivative & Basic Differentiation Properties Mon Nov. 7 19 Basic Probability Concepts PLS: 4.1-4.5 PLS: 4.12, 4.24, 4.34, 4.38 PLS: P. 612, #90, 91, 92 Mon Sep. 19 5 PLS: 5.1, 5.3 PLS: 5.2, 5.26 Discrete Probability Distributions Wed Nov. 9 Exam II 20 Uniform and Normal Continuous Distributions Measuring Change: Marginal Analysis PLS: 14.7 (Pg. 612-631) Wed Sep. 21 PLS: 6.1-6.4 PLS: 6.2, 6.6, 6.8, 6.16, 6.24 6 Mon Nov. 14 PLS: P. 628, #43, 46, 49 21 Derivative of Exponential and Logarithmic Functions PLS: 15.1-15.2 (Pg. 639-651) PLS: P. 643, #30, 38, 40 PLS: P. 652, #64, 72 Mon Sep. 26 PLS: 7.1-7.3 PLS: 7.8, 7.12 Sampling Distributions Wed Nov. 16 7 22 Nov. 21-25 Confidence Interval Estimation for the Mean Confidence Interval Estimation for the Proportion and Determining Sample Size Thanksgiving Break Wed Sep. 28 PLS: 8.1-8.2 PLS: 8.10, 8.16, 8.22 8 PLS: 16.4, 16.6 (Pg. 738-751, 759-771) PLS: P. 749, #84, 86 PLS: P. 768, #33, 34, 35, 36 Mon Oct. 3 PLS: 8.3-8.5 PLS: 8.28, 8.38, 8.48 Mon Nov. 28 Nonlinear Optimization 9 23 Wed Oct. 5 Exam I 10 Simple Interest and Compound and Continuous Compound Interest Wed Nov. 30 Handouts TBA 24 Oct. 10 Columbus Day Holiday Mon Dec. 5 Handouts TBA Future Value of an Annuity 25 One-Sample Hypothesis Test for the Mean Tues Oct. 11 PLS: 9.1-9.3 PLS: 9.14, 9.24, 9.30, 9.48 11 Wed Dec. 7 Student Surveys and Review 26 One-Sample Hypothesis Test for the Proportion Wed Oct. 12 PLS: 9.4-9.5 PLS: 9.58, 9.60 12 Mon Dec. 12 Comprehensive Final Exam
QTM1010: Quantitative Methods for Business Analytics II This course explores decision-making problems in a managerial context using algebraic, spreadsheet, graphical, and statistical models. The focus is on understanding basic mathematical and modeling principles through the analysis of real data. The course emphasizes communicating in-context interpretations of the results of analysis in written, visual, and oral form. A foundation in introductory statistics and use of spreadsheets is essential because these concepts are extended and reinforced throughout the course. Topics include introductions to linear regression, time series analysis, linear programming, decision analysis, and simulation. It emphasizes the use of appropriate software and the latest technological methods for accessing and analyzing data.
Day Date Tentative Topics Readings Practice Tentative Topics Readings Practice Class Class BLS13: 20.7 (Pg. 944-949) BZB13: 24 (Pg. 1115-1123) Course Introduction & Graphing Inequalities Wed. Mar. 2 Seasonality BLS13: 20.44 13 Wed. Jan. 20 1 BZB13: P. 1150 #2, 9 Mon. Mar. 7 Intro to Decision Analysis 14 BLS13: 17.1-17.5 (Pg. 778-797) BLS13: 17.4, 17.16, 17.26 Mon. Jan. 25 Linear Regression 2 BZB13: 24 (Pg. 1124-1130) BZB13: P. 1156 #18, 28 Wed. Mar. 9 Risk and Sensitivity Analysis 15 BLS13: 17.7-17.8 (Pg. 801-811) BLS13: 17.42, 17.58 Wed. Jan. 27 Residual Analysis 3 Mar. 14-18 Spring Break BLS13: 18.1-18.2 (Pg. 830-838) BLS13: 18.4, 18.5, 18.14 Mon. Feb. 1 Intro to Multiple Regression BZB13: 24 (Pg. 1130-1146) BZB13: 25 (Pg. 1176-1186) BZB13: P. 1162 #40, 53 BZB13: P. 1209 #3, 6 4 Mon. Mar. 21 Decision Tree Analysis 16 Wed. Mar. 23 Intro. to Simulation Model Assumptions, Residual Analysis BLS3: 18.3-18.4 (Pg. 839-843) BLS13: 18.18, 18.26 17 Wed. Feb. 3 5 BZB13: 25 (Pg. 1186-1197) Mon. Mar. 28 Simulation in Excel BZB13: P. 1210 #25, 21 BZB13: P. 1218 #29, 33 18 BLS13: 18.6 (Pg. 849-856) Mon. Feb. 8 Dummy Variables BLS13: 18.44 6 BZB13: 25 (Pg. 1197-1204) Wed. Mar. 30 Simulation 19 Quadratic Regression & Transformations BLS13: 19.1-19.2 (Pg. 883-893) BLS13: 19.6, 19.10 Wed. Feb. 10 Wrap-Up Simulation & Review for Exam 2 7 Mon. Apr. 4 20 Feb. 15 Presidents Day Holiday Wed. Apr. 6 Exam II 21 Intro. to Linear Programming (Model Formulation & Graphical Solution) Linear Programming (Computer Solution & Sensitivity Analysis) Tues . BLS13: 19.3-19.4 (Pg. 894-903) BLS13: 19.16, 19.24 BZB13: 21 (Pg. 960-986) BZB13: P. 994 #24, 25, 42 Feb. 16 Collinearity & Model Building Mon. Apr. 11 8 22 BZB13: 22 (Pg. 1002-1021) BZB13: P. 1029 #19, 20, 52 Wrap-Up Multiple Regression & Review for Exam 1 Wed. Apr. 13 23 Wed. Feb. 17 9 Apr. 18 Patriots Day Holiday Mon. Feb. 22 Exam I 10 BZB13: P. 1082 #12, 20 Linear Programming (Modeling Examples) BZB13: 23 (Pg. 1041-1060) Wed. Apr. 20 Introduction to Time Series & Business Forecasting BLS13: 20.1-20.3 (Pg. 916-922) 24 Wed. Feb. 24 BLS13: 20.4 11 Linear Programming (Modeling Examples) BZB13: 23 (Pg. 1061-1776) BZB13: P. 1096 #42. 58 Mon. Apr. 25 25 Least-Squares Trend-Fitting and Forecasting & Autoregression BLS13: 20.4-20.5 (Pg. 923-939) BLS13: 20.12, 20.28 Mon. Feb. 29 12 Review & Student Surveys Wed. Apr. 27 26 Final Exam
QTM2000: Case Studies in Business Analytics This course builds on the modeling skills acquired in the QTM core with special emphasis on case studies in Business Analytics the science of iterative exploration of data that can be used to gain insights and optimize business processes. Data visualization and predictive analytics techniques are used to investigate the relationships between items of interest to improve the understanding of complex managerial models with sometimes large data sets to aid decision-making. These techniques and methods are introduced with widely used commercial statistical packages for data mining and predictive analytics, in the context of real- world applications from diverse business areas such as marketing, finance, and operations. Students will gain exposure to a variety of software packages, including R, the most popular open-source package used by analytics practitioners around the world. Topics covered include advanced methods for data visualization, logistic regression, decision tree learning methods, clustering, and association rules. Case studies draw on examples ranging from database marketing to financial forecasting. This course satisfies one of the core requirements towards the new Business Analytics concentration. It may also be used as an advanced liberal arts elective or an elective in the Quantitative Methods or Statistical Modeling concentrations.
Day Date Subject Matter Reading & Cases Deliverables Day Date Subject Matter Reading & Cases Exercises 1 R 1 Sep Course Overview SPB 1.1-1.7 14 R20 Oct Mid- Term Exam SPB 2.1-2.3 2 T6 Sep Data Preparation and Visualization Introduction to Tableau Data Visualization SPB 2.4-2.5 SPB 3.1-3.3 Case: Superstore Subset SPB 3.4-3.6 15 T 25 Oct Classification: SPB 10.4 Logistic Regression 3 R8 Sep In-Class Modeling Activity Tableau Case : Superstore Subset 16 R27 Oct Final Project Kick-off Exercise 6 Due Exercise 1 4 T 13 Sep Introduction to R & RStudio: Handout Due 17 T 1 Nov Prediction: Regression Trees SPB: 9.1-9.4,9.6 Data Input and Management Case: Directors & Movies (CART) Case: Ownership (SPB) 5 R 15 Sep Exploratory Data Analysis and Case: Directors & Movies 18 R3 Nov Prediction: CART SPB: 9.7-9.9 Case: Toyota SPB: 14.1-14.4 Case: Public Utilities SPB: 14.5 Case: Universities & Colleges SPB: 13.1-13.5 Case: Phone Faceplates SPB: 13.1-13.5 Visualization in RStudio Lynda.com video 19 T8Nov Unsupervised Learning: Agglomerative Clustering K-Means Clustering Exercise 7 Due Exercise 2 6 T 20 Sep Predictive Analytics: SPB 6.1-6.4 Due 20 RIO Nov Linear Regression in RStudio Case: Toyota 7 R22 Sep Variable Selection & Model Evaluation Case: Toyota 21 T 15 Nov Unsupervised Learning: Association Rules Association Rules Market Basket Thanksgiving Week In-class Predictive Exercise 22 R 17 Nov Exercise 8 Due Exercise 3 8 T 27 Sep Prediction / Classification: Case: German Credit Due 21-25 Nov k-Nearest Neighbors (k-NN) SPB 7.1-7.3 23 T29Nov In-Class Modeling Activity: Association Rules Market Basket: Rattle in R Case: LastFM 9 R29 Sep Classification: Naive Bayes SPB 8.1-8.3 Exercise 4 24 R 1 Dec Project Presentations 10 T4 Oct Classification: Due Naive Bayes Prediction / Classification 25 T6 Dec Project Presentations 11 R60ct T 11 Oct Babson Monday - No Class 26 R8Dec Summary & Review Projects Due 12 R 13 Oct Prediction / Classification M 12 Dec Final Exam Exercise 5 13 T 18 Oct Classification: SPB 10.1-10.3 Due 1030- 1230 Logistic Regression
QTM1000 & QTM1010 QTM1000 & QTM1010 George Recck George Recck
QTM1000 & QTM1010 Recck QTM1000 and QTM1010 Focus on Basic Analytics QTM1010 Emphasis on Case Studies Beginning of Class Three Minute Quiz Collect and Analyze Real Data Groups: Six or Seven Groups per Class Members Randomly Assigned Occasionally Switch Groups One Report per Group Random Selection for Class Presentation Palisade s: @RISK and Decision Tree Largest Installed Base is Babson College Second Largest Installed Base is ?__________ End of Class 20 to 30 Minute Quiz
QTM2000 Dennis Mathaisel Babson s Most Successful Quantitative Course Demand has increased from only one section to nine Almost 2/3 of my QTM1000 students plan on taking it Students recognize that there is a strong employer demand for Quantitative Skills Skills are a Combination of Statistics Computer Science Quantitative Modeling Students expect this course to give their resumes a lift The course begins with Tableau for Visualization and moves to R for programing Models include Consumer Behavior and Finance Data sets usually include five to ten variables but range up to 300,000 rows This course has evolved over the last several years with help from three or four faculty
Day 21 Activity Derivatives and Non-Linear Optimization The manager of a 100-unit shopping center knows from experience that all units will be occupied if the rent is $1500 per month. A market survey suggests that, on average, one additional unit will remain empty for each $100 increase in rent. Assume that demand is a linear function of price. Construct a demand function D(p) and a R(p) revenue function. What price should the manager charge in order to maximize her revenue? 1) Determine the equation for the above graph. Take the first derivative of your function. f(x) = _________________ f (x) = _________________ Plot f(x) and f (x) 1) Identify the regions in which f(x) is increasing. Identify the regions in which f(x) is decreasing. Identify the local maxima of f(x). Identify the local minima of f(x). Identify the endpoint maxima of f(x). Identify the endpoint minima of f(x). Sketch f (x) on the same graph do not concern yourself with the y-values, just the shape. 2) 2) 3) 4) 5) 6) 7) 3) 4)
Day 22 Activity, Solver and Non-Linear Optimization The Total Cost of producing and selling Q 3D models is 2800 +7*Q. A market survey yields the following tables for the demand as a function of price. Price ($) Demand (3D models) 5 897 10 731 20 486 Use Trendline to produce an exponential model of the form DE(p) = D0 *(b^p). Produce an Excel Table with the columns listed below. The bottom line of the Table should contain the Solver solution.
Day 22 Activity, Solver and Non-Linear Optimization p DE RE CE PE P is the price, DE is the demand for the exponential model, RE is the revenue for the exponential model, CE is the cost for the exponential model and PE is the profit for the exponential model. Let p range from 0 to 50 in increments of 5. a) What is the value of D0 and b? b) Construct a scatter plot of DE, RE, CE and PE as a function of p. c) Use Solver to determine the value of price with causes profit to be a maximum. d) Does this price cause RE to be a maximum? e) Does this price cause CE to be a minimum? f) Is it easier to use calculus or Solver to solve this problem? g) Will both techniques yield the same solution?