Metropolitan NY-NJ Storm Surge Working Group: Resilience Conference 2024
The Metropolitan NY-NJ Storm Surge Working Group focuses on protecting the region against catastrophic flooding from ocean storm surges and rising sea levels. Key topics include storm surge barriers, flood protection proposals, and sea level rise projections. The group emphasizes a regional approach to enhance climate resilience and mitigate storm surge damage, as demonstrated by the aftermath of Hurricane Sandy in 2012.

Download Presentation

Please find below an Image/Link to download the presentation.
The content on the website is provided AS IS for your information and personal use only. It may not be sold, licensed, or shared on other websites without obtaining consent from the author. Download presentation by click this link. If you encounter any issues during the download, it is possible that the publisher has removed the file from their server.
E N D
Presentation Transcript
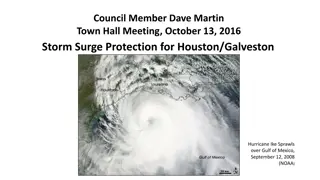
Metropolitan NY-NJ Storm Surge Working Group 2024 New Jersey Coastal and Climate Resilience Conference 14 March 2024
Agenda 1. Storm Surge Working Group (SSWG) and Need for Storm Surge Barriers Sally Bowman 2. USACE Proposal and Concerns About Draft Report Suzanne DiGeronimo and Daniel Gutman 3. SSWG Proposal for Flood Protection and How it Meets Civic Goals for HATS Robert Yaro
Metropolitan NY-NJ Storm Surge Working Group Storm Surge Working Group and Need for Storm Surge Barriers
The Metro NY-NJ Storm Surge Working Group A coalition of oceanographers, ecologists, engineers, urban planners, advocates, architects, and social scientists dedicated to the premise that: protection of the NY-NJ metropolitan region against catastrophic flooding from ocean storm surges and rising sea levels can best be secured by a regional approach.
Storm Surge Damage Increases With Sea Level Rise Union of Concerned Scientists
Sea Level Rise Projections (1995 2014 Baseline Period) 10th 25th 75th 90th Percentile Percentile Percentile Percentile 2030s 6 in. 7 in. 11 in. 13 in. 2050s 12 in. 14 in. 19 in. 23 in. 2080s 21 in. 25 in. 39 in. 45 in. 2100 25 in. 30 in. 50 in. 65 in. 2150 38 in. 47 in. 89 in. 177 in.
An Approach to Match the Scale of the Threat October 2012 Hurricane Sandy: Over $70 Billion in damages 60 deaths in region
A Regional Barrier System: An Essential Flood Protection Component A few miles of offshore sea gates would protect up to 900 miles of shoreline
Thames Barrier, LondonRotating Tidal Gates open closed
Eastern Scheldt Barrier, NLVertical Tidal Gates open closed
Maeslant Barrier, NLHorizontal Navigation Gate closed open
Global Storm Surge Barriers Netherlands IJssel Barrier (1965) Haringvliet (1971) Eastern Scheldt (1986) Hartel Barrier (1997) Maeslant Barrier (1997) United Kingdom Hull flood barrier (1980) Thames Barrier (1982) Ipswich (2019) Germany Eider Barrage (1973) Ems Barrier (2002) Italy MOSE Barrier, Venice (2017) Russia St Petersburg (2012) USA Fox Point, Rhode Island (1966) New Bedford, Massachusetts (1966) Moses Lake, Texas (1967) Stamford, Connecticut (1969) Freeport, Texas (1980) West Closure Complex, New Orleans (2011) Lake Borgne, New Orleans (2013) Seabrook Floodgate, New Orleans (2015)
Metropolitan NY-NJ Storm Surge Working Group USACE Proposal and Concerns About Draft Report
USACE Proposal Alternative 3B Storm Surge Barriers Tall Shoreline Barriers Short Shoreline Measures 3 Miles Miles Miles 62 18 Manual Shoreline Gates 135 Gates
Tall Shoreline Barriers Floodwalls Levees Reinforced Dunes 39 11 12 Miles Miles Miles
Levees and Dunes USACE Proposal for Liberty State Park Staten Island Reinforced Dune
Floodwalls Floodwall USACE Proposal for Hudson River Park
USACE Proposal Exchange Place, Jersey City
USACE Proposal Grand Street, Jersey City
General Concerns about USACE proposal Shoreline floodwalls diminish waterfront access and views (e.g. Jersey City), and can divide communities Many low income, minority, and smaller communities are not protected from storm surge (e.g. Raritan Valley & Bay) No analysis of reliability. Failure to close manual gate could flood large area Each proposed floodwall and smaller surge barrier will be a lightning rod for community opposition, controversy, delay
Unwarranted Assumptions Bias HATS 1. Construction time for regional barriers will be 25 32 years Eastern Scheldt Barrier was constructed in 10 years 2. Regional barriers would close every 10 years, on average Eastern Scheldt closes every 1.25 years, St. Petersburg closes every 10 months 3. Induced flooding requires extensive (and expensive) mitigation Computer modeling ignored leakage and overtopping, which lower induced flooding 4. Approved plan moves immediately into design and construction Funding would likely not be available until another major storm. Later start date favors regional barrier solution
Environmental Issues When gates are open, environmental impacts are modest David Ralston, Woods Hole Oceanographic Institution, 2022 Slight flow reduction restores natural tidal levels to estuary Need analysis of environmental impacts during coastal storms No-build condition means significant environmental impacts from storm-surges (Draft Report, pp. 220, 226 230) Need comparison of environmental benefits of regional barrier protection vs. shoreline barrier protection during storm surges Need analysis of impacts on marine organisms NMF believes SSBs will have significant negative effects on fish
Metropolitan NY-NJ Storm Surge Working Group SSWG Proposal for Flood Protection and How it Meets Civic Goals for HATS
SSWGs Solution: A Layered Defense Strategy Layer 1 Storm Surge Protection Regional Seagates and Nature-Based Dunes Includes all communities (e.g. South Bronx, Astoria, South Williamsburg, Yonkers), and LGA, Hunts Point Market, Statue of Liberty, Governor s Island Secondary benefit: Allows normal storm water drainage into harbor Layer 2 Sea Level Rise Measures Low Berms and Bulkheads, Raised Streets and Buildings, Retreat Relieves pressure to use storm-surge barriers too often Layer 3 Coastal Ecosystems Restoration Accelerate Hudson Raritan Estuary and Hudson River Habitat restoration projects Flood benefit: dampens wave action and limits erosion Layer 4 Extreme Rainfall Strategies Networks of detention basins, swales, green roofs, etc. Upsize storm water drainage systems, where applicable
Metropolitan NY-NJ Storm Surge Working Group How SSWG s layered defense strategy meets goals for HATS study advocated by civic groups
EDF, RPA, Waterfront Alliance and other civic groups (& SSWG) advanced these goals for HATS Address all types of flooding Sea Level Rise, Storm Surge, Tides, Extreme Rainfall Engage frontline communities Prioritize people over property values Incorporate equity into cost-benefit analysis Maximize nature and minimize harm
Address all Types of Flooding SSWG s layered defense strategy: Storm Surge USACE Responsibility Sea Level Rise Joint USACE/State and Local Responsibility Extreme Rainfall State and Local Responsibility
Sea Level Rise Joint Responsibility State and local governments are best placed to lead long- term SLR planning But, along with storm surge, HATS should address initial SLR measures If no plan, increasing pressure to use gates as SLR increases Start with Alternative 2 short shoreline measures (36+ miles) and current NYC program (43 miles)
Engage Frontline Communities SSWG s layered defense strategy: Local governments will plan waterfronts to address long-term SLR (or plan retreat) with communities Cities efforts to mitigate extreme rainfall flooding will be discussed with communities
Prioritize people over property values SSWG s layered defense strategy: Protects all harbor communities equally Fosters equity in cost-benefit analysis because differences in community property values won t determine degree of protection
Maximize nature and minimize harm SSWG s layered defense strategy: Includes miles of nature-based dunes and Restores natural systems USACE responsibility USACE to complete environmental studies to ensure harms are identified and environmental benefits are assessed
Most Nature-Based Features Cannot Stop Major Storm Surges From Reducing Coastal Risk on the East and Gulf Coasts, National Research Council, 2014: [T]he level of risk reduction provided by oyster reefs and seagrasses appears much lower than that provided by constructed dunes and hard structures . . . Research has documented reductions in peak water levels from salt marshes and mangroves, but . . . many of these nature-based alternatives can only be used for coastal risk reduction at locations that have sufficient space between developed areas and the coastline. . . . Many large coastal cities lack the space necessary to take advantage of nature-based risk reduction approaches alone and will instead need additional hard structures to substantially reduce coastal hazards.
Key Points 1. Storm surge adds 10 15 feet on top of sea level rise 2. USACE proposal leaves out many communities and floodwalls diminish waterfront access and views 3. NY-NJ harbor lacks space for most nature-based measures to be effective 4. Regional barriers + nature-based dunes are very effective and protect all harbor communities equally 5. Any storm surge plan must include measures for sea level rise 6. USACE can address storm surge, ecosystem restoration, initial sea level rise, but not long-term SLR planning or extreme rain
Metropolitan NY-NJ Storm Surge Working Group EXTRA SLIDES
NOAA Exceedance Probability Levels at the Battery (2018) Annual Exceedance Probability Feet above NAVD88 Feet above MHHW Return Period 1% 100 yr 7.3 5.0 10% 10 yr 5.8 3.5 50% 2 yr 2.4 4.7 99% 1 yr 3.7 1.4
NOAA Exceedance Probability Levels at the Battery (2018) Annual Exceedance Probability Feet above NAVD88 Feet above MHHW Return Period 1% 100 yr 7.3 5.0 10% 10 yr 5.8 3.5 20% 5 yr 5.3 3.0 50% 2 yr 4.7 2.4 99% 1 yr 3.7 1.4