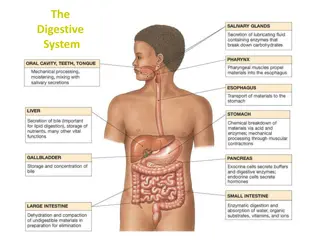
Investigating Amylase Activity in Starch Digestion

An investigation on amylase activity involving the digestion of starch was conducted, with methods for controlling temperature, calculating digestion rates, and improving data precision discussed. The effects of temperature on enzymatic activity and precision enhancement techniques were explored.

Download Presentation

Please find below an Image/Link to download the presentation.
The content on the website is provided AS IS for your information and personal use only. It may not be sold, licensed, or shared on other websites without obtaining consent from the author. Download presentation by click this link. If you encounter any issues during the download, it is possible that the publisher has removed the file from their server.
E N D
Presentation Transcript
Biology Higher Paper 1 Extended
Starch is digested by the enzyme amylase. A student did an investigation on amylase activity. This is the method used. 1. Mix amylase solution and starch suspension at 20 C in a boiling tube. 2. Remove a drop of the mixture every 30 seconds and test it for starch. 3. Continue testing every 30 seconds until no starch is detected. 4. Repeat the investigation at different temperatures. What apparatus should the student use to control the temperature of the mixture? ____________________________________________________________________________ [1 mark]
The starch suspension contained 0.8 g of starch. Complete Figure 1 by drawing a line of best fit. Calculate the mean rate of starch digested at 33 C. [2 marks] Mean rate of starch digested = grams per minute
appropriate curve of best fit drawn do not allow extrapolation to origin an answer of 0.2 gains 2 marks allow ecf from line of best fit in 5.2/1.2 allow 0.24 0.8 3.4 = 0.2
Describe two ways the student could improve the precision of his data. [2 marks] 1 ___________________________________________________ 2 ___________________________________________________
repeat at smaller temperature intervals (between 30 C and 50C) test at smaller time intervals allow description of suitable time interval (eg every 10 seconds) ignore use a more accurate stopwatch/thermometer
Explain why the rate of starch digested per minute at 60 C is lower than the rate at 40 C. ________________________________________________________ ________________________________________________________ [2 marks]
(because at 60 C or above 40 C some of) the enzymes are denatured (so) no longer fit the starch or (so) no longer catalyse the reaction
Predict the time taken untill no starch is detected at 10 C. Use information from Figure 1. [1 mark] Time until no starch is detected = minutes
This question is about transport in organisms A student investigates what happens to a plant cell when it is placed in water. The student looks at the plant cell through a microscope. Look at Figure 2. Explain why the plant cell swells up when the cell is placed in water. ___________________________________________________ ___________________________________________________ ___________________________________________________ ___________________________________________________ ___________________________________________________ ___________________________________________________ ___________________________________________________ ___________________________________________________ [4 marks]
because water enters (the cell/it/named cell) (from a lower concentration or more dilute solution) to a higher concentration by osmosis 06.1 02.1 do not accept salt/sugar/solution entering allow diffusion if clearly describing movement of water allow semi/ selectively permeable membrane or description 1 AO2 1 AO2 AO1 1 through a partially permeable membrane 1 AO1 4.1.3.2 Standard
Fish that live in fresh water absorb substances through the epithelial cells in their gills. Figure 3 shows the concentration of two different substances inside and outside agill epithelial cell. Draw one line from each substance to the process used to move it into the gill epithelial cell.
1 mark per line extra line from substance negates the mark for that substance
Structure X helps in the exchange of substances between the axolotl and the water. An animal called an axolotl lives in fresh water when it is young. Figure 4 shows a young axolotl. Explain how structure X helps to ensure rapid absorption of substances the axolotl needs for growth. Figure 4 [3 m ar ks ]
structure X has threads/filaments allow structure X are external gills allow description 06.3 02.3 1 (which) increases the surface area and provides a shorter diffusion path or a thin exchange surface 1 1
Yeast is an organism that respires anaerobically. Complete the word equation for anaerobic respiration in yeast Glucose +
07.1 03.1 ethanol either order 1 carbon dioxide
A student investigated the effect of glucose concentration on the rate of anaerobic respiration in yeast. This is the method used. 1. Put 10 cm3 of yeast suspension in a beaker. 2. Add 10 cm3 of 0.5 % glucose solution and mix. 3. Put 10cm3 of the mixture into a syringe. 4. Press the syringe until the mixture is visible at the end of the capillary tubing. 5. Record the starting position of the mixture. 6. Leave the syringe for 10 minutes. 7. Record the end position of the mixture. 8. Repeat steps 1 7 for four different concentrations of glucose solution. The student repeated the investigation a further two times. Figure 5 shows the apparatus the student used. Give two factors the student controlled in the investigation.
any two from: 07.2 03.2 2 volume of yeast suspension volume of glucose solution volume of (yeast and glucose) mixture time (for respiration) if no other marks awarded allow 1 mark for volume of solutions temperature or species of yeast 07.3 03.3 1
Calculate X in Table 1. cm3 X = [1 mark]
0.94 07.4 03.4 1
Plot the data from Table 1 on Figure 6. You should: label the y-axis use a suitable scale draw a line of best fit. (4 Marks)
07.5 03.5 y-axis labelled and appropriate scale chosen 1 allow 1 mark for 3 or 4 points correctly plotted points correctly plotted 2 line of best fit drawn line should be a smooth curve 1
Describe the patterns shown in the students data. ____________________________________________________________________________ ____________________________________________________________________________ ____________________________________________________________________________ [2 marks]
as the concentration of glucose increased so does the volume of gad/carbon dioxide produced begins to slow down/plateau (after 2.0%) 07.6 03.6 1 1
Environmental factors affect the rate of water loss from plants. Explain why increasing temperature increases the rate of water loss from plants. [2 marks]
08.1 04.1 more energy 1 (so rate of) evaporation increases 1
Give three other environmental factors that would increase the rate of water loss from plants. [3 marks] 1 ___________________________________________________ 2 ___________________________________________________ 3 ___________________________________________________
08.2 04.2 increased wind (speed) allow windy day 1 higher light intensity allow sunnier day 1 lower humidity allow dry day 1
The movement of water through a plant is called transpiration. What is translocation? ____________________________________________________________________ ____________________________________________________________________ ____________________________________________________________________ [1 mark]
08.3 04.3 movement of food/sugars through the phloem allow phonetic spelling of phloem 1
The heart keeps blood circulating round the body. A man has two problems with his heart: 1. 2. The man does not need a heart transplant. his heart is beating irregularly fatty deposits are building up inside the walls of his coronary arteries. Explain how the two problems could be treated to prevent a heart attack. [4 marks]
05.1 fit an artificial pacemaker 1 (which) will ensure his heart will beat/contract at regular intervals 1 if neither mark given, allow 1 mark for correct lifestyle change eg stop smoking fit a stent 1 (to) allow blood/oxygen/glucose to reach the heart muscle 1
A 60-year-old woman has chest pains. The pain is worse when she walks, and she often feels tired. The woman has aortic valve stenosis. A valve with stenosis has become stiff and narrow. Figure 7 shows the position of the aortic valve. Explain why aortic valve stenosis causes chest pains.
not enough (oxygenated) blood is leaving the heart (as valve is narrowed) 05.2 allow backflow of blood (into ventricle) allow less blood leaving heart or less blood passing through valve 1 AO3 AO1 1 (therefore) the heart has to beat faster in order to supply enough oxygen to cells AO1 1 4.2.2.2 High
The woman needs to have an aortic valve replacement. Table 2 shows information about two types of aortic valve replacement. VRS TAVI General anaesthetic Local anaesthetic Type of anaesthetic used Evaluate the use of TAVI for the woman. Chest is opened. Heart is stopped and a machine circulates blood around the body. Diseased valve is removed and replaced with the new heart valve. A hollow tube (catheter) with a balloon at its tip is inserted into an artery in the chest and pushed [4 marks] through to the valve. How the heart valve is accessed The balloon is inflated to open the new valve inside the diseased valve. The balloon is deflated and removed. All ages. Not suitable for high- risk patients due to use of general anaesthetic. Mostly used for high-risk patients, eg older patients. Who has this type of surgery 2.1% 5.1% *Mean percentage of people who died whilst in hospital 62.4% 67.8% *Risk of death five years after surgery
Indicative content advantages less invasive or it doesn t involve open heart surgery so shorter recovery period only a local anaesthetic is used or general anaesthetic isn t used or heart isn t stopped during surgery so less risky woman is older (60) or in high-risk group so probably more suitable success rates are similar to VR in the mid/long term disadvantages there is a higher risk of death or complication the information could be flawed as the percentages come from one clinical trial the diseased valve could cause future problems as it would be left inside the heart.
In 2014 an outbreak of Tobacco Mosaic Virus (TMV) at a plant producer caused the loss of 15 million petunia plants in 3 weeks. TMV infection was initially found in only one plant. Explain how the spread of TMV to the other plants could have been prevented. ____________________________________________________________________________ ____________________________________________________________________________ ____________________________________________________________________________ ____________________________________________________________________________ [3 marks]
remove the infected plants and those close to them destroy/burn them disinfect the area to kill the (remaining) viruses/pathogens 06.1 1 1 1
TMV can be found in the water that is collected. When the collected water is used on crop plants it can spread the virus very rapidly. Scientists have investigated the effectiveness of a type of filter called slow sand filters (SSFs) in removing TMV from TMV from recycled water. SSFs have microorganisms in them that can remove pathogens from the water as it passes through. The scientists added TMV to water from soil and passed it through an SSF. The scientists recorded the concentration of TMV in the water before and after it was passed through the SSF. The investigation lasted 12 weeks. The safe level of TMV in the water is taken as 0.20 arbitrary units. Figure 8 shows the results. Calculate the percentage decrease in TMV after the water passes through the SSF at 2 weeks. Give your answer to 3 significant figures.
1.24 and 1.09 an answer of 12.1(%) gains 4 marks 06.2 figures read from graph allow 0.5 square tolerance 1 1.24 1.09 1 100 1.24 12.09(677) 1 12.1(%) 1
Give two conclusions you can make from the data shown in Figure 8. [2 marks] 1 2 As soon as the SSF was set up (week 0) the scientists recorded the first set of results. Why did the scientists record the first set of results as soon as the SSF was set up? [1 mark]
the SSF reduces the concentration of TMV in the water the concentration of TMV falls to a safe level after 9 weeks as a control or to show that the microorganisms in the SSF remove the TMV 06.3 1 1 06.4 1
Figure 9 shows a photograph of plant root tip cells. Explain what is happening to the root tip cells in Figure 9. You should refer to the labelled cells in your answer. [4 marks]
Level 2: Relevant points (features/processes) are identified, given in detail and logically linked to form a clear account. Level 1: Points (features/processes) are identified and stated simply, but their relevance is not clear and there is no attempt at logical linking. 07 3 4 1 2 No relevant content. 0 Indicative content the cells are dividing by mitosis or process of cell division is mitosis in cell A the DNA is replicating/doubling and other sub-cellular structures/ribosomes/mitochondria are also replicating in cell C one set of chromosomes is being pulled to each end of the cell in cell D one set of chromosomes at each end and the cytoplasm starts to divide. cell B is not dividing or is preparing to divide.


 water bath")


 blood")


 at a plant")


 are")