Impact of CSA Membership on Food Consumption and Behavior

This study explores the influence of Community Supported Agriculture (CSA) program participation on consumer food habits, attitudes, and behavioral changes. It investigates the shifts in fruit/vegetable consumption, meal preparation, use of unfamiliar produce, storage methods, types and amounts of food purchases, and eating out behaviors. The research suggests that CSA membership could potentially lead to positive dietary improvements, similar to the effects observed in other programs promoting healthy eating habits.

Download Presentation

Please find below an Image/Link to download the presentation.
The content on the website is provided AS IS for your information and personal use only. It may not be sold, licensed, or shared on other websites without obtaining consent from the author. Download presentation by click this link. If you encounter any issues during the download, it is possible that the publisher has removed the file from their server.
E N D
Presentation Transcript
Food Consumption, Attitude, and Behavioral Change Among CSA Members Kynda Curtis, Karin Allen, and Ruby Ward Department of Applied Economics and Department of Nutrition, Dietetics and Food Science Utah State University
Overview Literature on local food consumption commonly examines consumer willingness to pay (WTP) for fresh produce, motivations for local foods purchases, farmers market attendance, and/or CSA membership Few studies examine the impact of purchases through direct marketing channels on consumer attitudes, dietary choice and food purchasing decisions Majority focus on the impacts of public programs on fruit/vegetable consumption among low income individuals, such as the WIC and Senior Farmers Market Nutrition Programs
Study Purpose Examine the impacts of CSA program participation on consumer food purchasing habits and dietary choice Specifically changes in behavior and attitudes toward fruit/vegetable consumption, and Preparation of nutritionally enhanced meals Use/preparation of unfamiliar produce items Storage, such as canning, drying, freezing of items Food purchases, by type and amount Consumption of food outside the home (eating out) If CSA program participation does indeed produce attitude and behavioral change in its participants Public policy encouraging CSA program membership, such as is currently done with farmers markets, may provide another vehicle for fostering dietary improvements Especially in areas where farmers markets may not be available or accessible for targeted populations - Dollahite et al. (2005) farmers market access barrier to WIC program
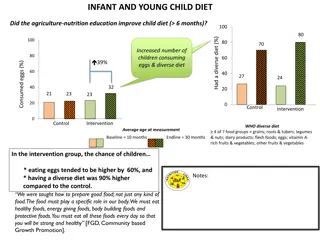
Literature Overview Dietary Changes Perez et al. (2003) CSA participants were more likely to eat more fruits and vegetables and to cook more creatively Conrey et al. (2003) WIC Program - Increased fruit and vegetable consumption was directly related to the nutritional information which supplemented the program Johnson et al. (2004) Home-bound senior program - participants increased produce intake by a full serving per day, but likely due to additional education and policy efforts Lea et al. (2006) The inclusion of locally-sourced salad bars in the Australian public school system increased produce consumption by both students and staff
Literature Overview Consumer Changes Ostrum (1997) Participation affected consumers eating habits affected and other consumption patterns CSA members tend to develop a stronger sense of community because consumers believe buying local is better for the environment, the health of the community and the health of their family members. O Hara and Stangl (2002) Consumers environmental concerns grew stronger over the course of CSA membership Consumers increased their desire to eat produce while it was in season Consumers increased their desire to reduce packaging waste Russell and Zepeda (2007) Educational components of CSAs increased consideration of food seasonality
Methodology A total of 14 participants in 4 CSA programs in Logan, Utah A series of surveys, pre-program (early June 2012), monthly, and post program (December 2012) were administered Participants submitted their monthly grocery store and other food purchase receipts during the six-month period All weekly CSA basket contents were tracked by item and weight Nutritional intake information was taken from receipts Survey data provides stated information on changes in Food preparation behavior The use of new, unfamiliar food varieties Number of of meals consumed outside the home Attitudes regarding fruit/vegetable consumption and dietary choice
Sample Stats/Demographics 75% married and 81% female 28.6% have children under 18 78.6% white ethnicity 77% have a four-year degree or higher 65% employed full time 42.7% reported an annual income above $50,000 29% were CSAs members the previous year 14.3% classified themselves as vegetarians Most learned about their CSA program from friends and family (53%), followed by a website (11%)
Lifestyle/Attitudes (Scale of 1-5, where 5 is Strongly Agree) I am a vegetarian or vegan I am concerned about the origin of my food Agricultural open space is important to me Supporting local farmers is important to me Physical activity is an important part of my routine I eat out frequently I buy products with low environmental impact I am concerned about my health/diet I have little time to prepare meals I am concerned about the safety of my food 0 0.5 1 1.5 2 2.5 3 3.5 4 4.5 5
Primary Motive for CSA Program Participation 18 16 14 Organic products Local products 12 Support local farmers 10 Product freshness/taste/flavor Environment reasons 8 Food safety reasons Dietary/nutritional reasons 6 Other (please specify) 4 2 0
Reasons for Non-Membership in Previous Year Unfamiliar with CSA program (40%) Did not live in the area (27%) Financial reasons (13%) Needed to find others to split share (6.6%) Couldn t find good quality (6.7%) CSA was full (6.7%)
Respondent Preferences Pre and Post Description Serving 1-2 people Serving 2-3 people Serving 3-4 people Cooking classes Preparation ideas/recipes Canning/preserving Wine pairing Food pairing Food safety Farm visits/tours Other - Urban Gardening Workshops Other - Beer/Cocktail Pairing A product of your state (Utah) A product of the USA A product from outside of the USA A product identified as organic (regardless of origin) A product identified as natural (regardless of origin) Other - Nutrition Information Other - Organic and local The quality of the product The product origin (place of production) The product with the lowest price Other - Health Benefits Pre % 35.7% 57.1% 7.1% 50.0% 92.9% 57.1% 42.9% 35.7% 21.4% 57.1% 7.1% 0.0% 15.4% 38.5% 0.0% 23.1% 15.4% 7.7% 0.0% 64.3% 7.1% 21.4% 7.1% Post % 57.1% 42.9% 0.0% 57.1% 78.6% 71.4% 50.0% 35.7% 14.3% 35.7% 0.0% 7.1% 8.3% 41.7% 0.0% 25.0% 16.7% 0.0% 8.3% 78.6% 14.3% 7.1% 0.0% What is your preferred basket size? Which educational programs are of interest to you? When purchasing food products, which label is most important? When purchasing food products, which of the following is most important?
Respondent Preferences Pre and Post When making produce purchases, how important are the following product features? Pre % Post % Product variety Product quality Product value Product appearance Produced locally (in your State) Specialty item Product pricing Organic production Product freshness Product taste Know grower/farmer 3.4 4.2 3.7 3.1 3.5 2.2 3.3 3.5 3.9 4.5 2.8 3.0 4.1 3.8 2.8 3.4 1.8 3.5 2.9 4.0 4.2 2.5
Pre and Post Differences Increased desire for smaller basket size Increased interest in canning, cooking, and wine pairing classes Decreased interest in food safety and recipe preparation classes, and farm tours Labeling: organic and natural labeling became more important, while local (in state) labeling became less important Quality and origin became more important, while pricing became less important Appearance, variety, and organic production became less important when purchasing produce Meals consumed at home weekly increased from 17.2 to 17.6
Post Perceptions 100% would subscribe to a CSA program in the future 79% expressed an interest in a winter CSA program 71% felt that the recipes provided with their CSA membership and the availability of unknown produce encouraged them to preserve more food during the CSA season than normal 71% felt that their fruit and vegetable consumption was much higher (71%) 57% saw some improvement in their nutritional intake 93% felt that the recipes and the availability of previously unknown products in their baskets changed their food preparation or cooking knowledge Participants showed a strong interest in receiving processed food item in their baskets
Average Weekly Meals Consumed at Home by Percentage, June to November 81.00% 80.52% 80.00% 79.22% 79.00% 78.35% 78.00% 77.00% 76.62% 76.00% 75.32% 76.19% 75.00% 74.00% 73.00% 72.00% 1 2 3 4 5 6
Monthly Survey Results (June to Dec) The percentage of CSA basket items used hovered around 90% throughout the season The primary reason given for not using all baskets items was the inability to prepare unfamiliar items, 27% During the first three months, participants were preparing around 72% of the unfamiliar items this declined steeply in September (45%) Recipe usage also decreased across the season (50% to 27%) The storage/canning of produce peaked in August at 82% then declined throughout the fall reaching 18% in November
Results Food Purchase/Consumption CSA Months Non-CSA Months Packaged Meals 3% Packaged Meals 8% All Others 16% All Others 16% Grains 6% Grains 8% Fresh 21% Fresh 39% Produce 45% Produce 32% Dairy 21% Packaged 11% Packaged 6% Dairy 26% Meat 9% Meat 10%
Results Food Purchase/Consumption Fresh produce purchases were significantly higher (p<0.05) during CSA participation, but total produce purchases did not differ Grain product purchases were significantly lower (p<0.05) during CSA participation, but did not differ between months Intake of Vitamin C and Folic Acid was significantly higher during CSA participation, consistent with increased vegetable consumption Taken together, these results suggest fresh produce is replacing grain products during CSA participation, independent of any seasonal effect
Conclusions Stated results matched revealed results Need for more research CSA increased eating at home and produce consumption CSA increasing some nutrition Might have made them more adventurish eaters September dropped off. Might be more willing in summer to try new things and use produce. As got back to school, back to old routines.
THANK YOU.. Questions?


")