Infant and Young Child Nutrition Interventions Impact on Diet and Growth
This study evaluates the impact of agriculture-nutrition education interventions on infant and young child nutrition, specifically focusing on diverse diet consumption, egg consumption, and growth indicators such as stunting and hemoglobin levels. The intervention group showed higher rates of diverse diet consumption and egg intake compared to the control group. Furthermore, factors affecting hemoglobin levels and anemia prevalence among infants in Upper Manya Krobo district were analyzed.
- Infant nutrition
- Young child diet
- Agriculture-nutrition education
- Growth promotion
- Hemoglobin levels

Download Presentation

Please find below an Image/Link to download the presentation.
The content on the website is provided AS IS for your information and personal use only. It may not be sold, licensed, or shared on other websites without obtaining consent from the author. Download presentation by click this link. If you encounter any issues during the download, it is possible that the publisher has removed the file from their server.
E N D
Presentation Transcript
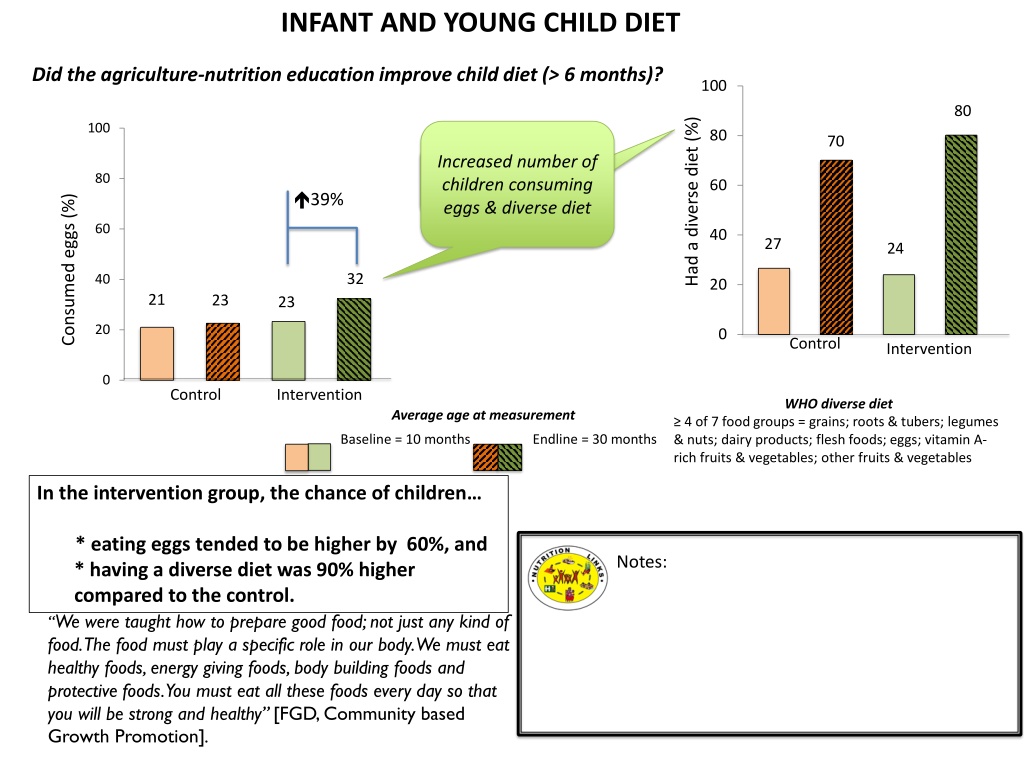
INFANT AND YOUNG CHILD DIET Did the agriculture-nutrition education improve child diet (> 6 months)? 100 80 Had a diverse diet (%) 100 80 70 Increased number of No intervention effect on stunting children consuming eggs & diverse diet 80 60 39% Consumed eggs (%) 60 40 27 24 32 40 20 21 23 23 20 0 Control Intervention 0 Control Intervention WHO diverse diet Average age at measurement 4 of 7 food groups = grains; roots & tubers; legumes & nuts; dairy products; flesh foods; eggs; vitamin A- rich fruits & vegetables; other fruits & vegetables Baseline = 10 months Endline = 30 months In the intervention group, the chance of children * eating eggs tended to be higher by 60%, and * having a diverse diet was 90% higher compared to the control. We were taught how to prepare good food; not just any kind of food. The food must play a specific role in our body. We must eat healthy foods, energy giving foods, body building foods and protective foods. You must eat all these foods every day so that you will be strong and healthy [FGD, Community based Growth Promotion]. Notes:
INFANT AND YOUNG CHILD NUTRITION (GROWTH) Did the agriculture-nutrition education affect children s growth? 0.25 Control Intervention 30.0 24.1 25.3 Median for a healthy population 0.00 Length-for-age (Z-score) -0.25 Stunted (%) 20.0 15.5 14.1 -0.50 Length-for-age 0.25 Z-scores * -0.75 10.0 -1.00 -1.25 0.0 -1.50 Average age at measurement Control Intervention Baseline = 10 months Endline = 30 months * p<0.05; no effect on weight-for-ageand weight-for-length Nutritional status indicators for all children (%) Notes: Moderate Severe Baseline Endlin e Baseline Endline Stunted 14.7 24.6 3.1 3.3 Underweight 13.2 12.4 3.0 1.9 Wasted 6.3 3.1 0.8 0.5
INFANT AND YOUNG CHILD NUTRITION (HEMOGLOBIN) What factors are associated with child s hemoglobin among infants in Upper Manya Krobo district? Infants 0-5.9 months (n=579) Relationship to hemoglobin* B (SE) 11.2 10.6 Exclusive breastfeeding (BF) None 0.10 (0.16) Maternal Hb (g/dL) Higher 0.18 (0.05) Caesarean section Lower -0.55 (0.25) BF within 1h after birth Lower -1.06 (0.30) Infant had fever in past 2 wk Lower -0.63 (0.20) Infant age (mo) Lower -2.32 (0.18) Infants 6-12 months (n=504) Relationship to hemoglobin* Age2 and Age* BF within 1 hr included in model. *at least p<0.05 B (SE) Maternal Hb (g/dL) Higher 0.16 (0.04) Notes: Infant age (mo) Maternal education (none) Infant sex (male) Higher 0.08 (0.04) Lower -0.43 (0.21) Lower -0.38 (0.12) *at least p<0.05
INFANT AND YOUNG CHILD NUTRITION (ANEMIA) How rapidly does anemia increase with age among Upper Manya Krobo infants? What factors are associated with anemia among infants? Relationship to anemia* Odds ratio (95% CI) 70 Infants 0-5.9 months (n=579) 62.9 60 More than doubled the odds Infant had fever in the past 2 weeks Rate of anemia (%) 2.7 (1.3 to 5.5) 50 Infants 6-12 months (n=504) 40 Almost doubled the odds Almost doubled the odds Decreased odds by almost 20% Infant sex (male) 1.7 (1.2 to 2.6) 30 Maternal education (none) 1.9 (1.1 to 3.3) 20 14.5 Maternal hemoglobin (g/dL) 0.8 (0.7 to 0.95) 10 * At least p<0.05; as compared to the reference group (e.g., not with fever) 0 0 to 5.9 6 to 12 Age (months) Notes:
INFANT AND YOUNG CHILD PSYCHOSOCIAL STIMULATION How much psychosocial child stimulation happens in Upper Manya Krobo households at the beginning of Nutrition Links ? How is stimulation related to mental development? Relationship with stimulation* Standardized beta 6 Stimulation score Receptive milestones (Infant understands commands)1 Expressive milestones (Infant communicates wants/needs)1 Cognitive milestones Increased 0.13 5 4 Increased 0.21 3 2 1 Increased 0.24 (Infant processing/memory abilities)2 0 < 6 6 to 12 At least p<0.05; n=316; modified Development Milestones Checklist II & Bayley 1Other factors that increase are: age, length-for-age 2 Other factor that increases is: age Child age (months) Score: based on 6 mother-reporteditems on availability of books and play materials in the home What factors are associated stimulation? Notes: Standardized beta Relationship to stimulation* Child s age Child s dietary diversity Increased 0.55 Increased 0.17 * p<0.001; n=1081

")
")
")

![READ [PDF] Dash diet Cookbook for beginners: 365 days of simple, healthy, low-s](/thumb/2057/read-pdf-dash-diet-cookbook-for-beginners-365-days-of-simple-healthy-low-s.jpg)