Overview of Teachers' Salary Increases and Compensation Benefits (1989-2019)

This data provides a comprehensive overview of salary increases for teachers from 1989 to 2019 under various administrations, along with details on teaching and administrative positions, monthly salaries, and compensation benefits. It covers the different tranches, positions, and benefits such as PhilHealth, Pag-IBIG, insurance, and bonuses.

Download Presentation

Please find below an Image/Link to download the presentation.
The content on the website is provided AS IS for your information and personal use only. It may not be sold, licensed, or shared on other websites without obtaining consent from the author. Download presentation by click this link. If you encounter any issues during the download, it is possible that the publisher has removed the file from their server.
E N D
Presentation Transcript
Table I. Salary Increases of Teachers (1989 to 2019) Executive Order (EO) No. 389 (4 tranches) EO 811 (4 tranches) G. Arroyo & B. Aquino Administration EO 201 (4 tranches) B. Aquino & R. Duterte Administration RA 6758 EO 219 EO 22 EO 611 EO 719 SG POSITION SG C. Aquino Admin. 1989 3,102 3,309 3,540 J. Estrada Admin. 2000 9,466 10,003 10,635 F. Ramos Administration G. Arroyo Administration 1994 3,902 4,009 4,240 1995 4,902 5,009 5,240 1996 6,013 6,243 6,568 1997 8,605 9,121 9,668 2001 9,939 10,535 11,167 2007 10,933 11,589 12,284 2008 12,026 12,748 13,512 2009 2010 15,649 16,726 17,880 2011 17,099 18,333 19,658 2012 18,549 19,940 21,436 2016 19,077 20,651 22,328 2017 19,620 21,387 23,257 2018 20,179 22,149 24,224 2019 20,754 22,938 25,232 Teacher I Teacher II 11 Teacher III 12 10 11 14,198 12 15,119 13 16,101 Master Teacher I Master Teacher II 17 Master Teacher III 18 Master Teacher IV 19 16 4,786 5,496 6,486 8,202 12,206 13,427 14,098 15,508 17,059 18 22,214 25,259 28,305 31,351 33,452 35,693 38,085 40,637 5,201 5,901 6,901 8,712 12,938 14,232 14,944 16,438 18,082 19 23,703 27,088 30,474 33,859 36,409 39,151 42,099 45,269 5,670 6,370 7,370 9,274 13,715 15,087 15,841 17,425 19,168 20 25,295 29,052 32,810 36,567 39,768 43,250 47,037 51,155 6,199 6,899 7,899 9,891 14,538 15,992 16,792 18,471 20,318 21 26,671 30,945 35,219 39,493 43,439 47,779 52,554 57,805 Note: Master Teacher III and IV positions were created in 2010 and 2012, respectively DEPARTMENT OF EDUCATION DEPARTMENT OF EDUCATION 1
Table 2. Basic Monthly Salary, Teaching Positions Position SG Monthly Salary, PhP (2019/Fourth Tranche SSL) Plantilla Items (As of June, 2019) Authorized Filled 11 12 13 18 19 20 468,453 139,487 212,384 41,854 16,810 Teacher I Teacher II Teacher III Master Teacher I Master Teacher II Master Teacher III TOTAL 436,275 127,999 207,613 39,950 15,828 20,754.00 22,938.00 25,232.00 40,637.00 45,269.00 51,155.00 68 65 879,056 827,733 Note: 1. There are others teaching positions such as SPED Teachers. 2. There are step increments within salary grade. DEPARTMENT OF EDUCATION DEPARTMENT OF EDUCATION 2
Table 3. Basic Monthly Salary, Administrative Track Position SG Monthly Salary, PhP (2019/Fourth Tranche SSL) 27,755.00 30,531.00 33,584.00 36,942.00 40,637.00 45,269.00 45,269.00 51,155.00 57,805.00 65,319.00 Plantilla Items (As of June 2019) Authorized Filled 14 15 16 17 18 19 19 20 21 22 7,259 2,204 11,013 418 228 1029 15,280 5,810 2,106 1,316 1,435 47,918 Head Teacher I Head Teacher II Head Teacher III Head Teacher IV Head Teacher V Head Teacher VI School Principal I School Principal II School Principal III School Principal IV Asst. School Principal I, II, III 18-20 TOTAL 6,622 1,858 10,351 383 204 905 13,432 5,357 1,992 1,273 950 43,327 DEPARTMENT OF EDUCATION DEPARTMENT OF EDUCATION 3
Table 4. Current Entry Level (Teacher I) Compensation & Benefits Compensation & Benefits (C&B) Amount Remarks Nominal Annual Salary PhP 249,048 Php20,754 / mo (SSL Tranche 4) Phil-Health Employer Share PhP 3,000 Php 250 437.50 / mo PAG-IBIG Employer Share PhP 1,200 Php 100 / mo Retirement and Life Insurance Premium (RLIP) PhP 29,886 12% of basic salary Employees Compensation Insurance Premium PhP 1,200 Php 100 / mo Clothing/Uniform Allowance PhP 6,000 Php 6,000 / year Cash Gift PhP 5,000 Php 5,000 / year Productivity Enhancement Incentive PhP 5,000 Php 5,000 / year Personnel Economic Relief Allowance PhP 24,000 Php 2,000 / mo Mid-year Bonus PhP 20,754 One-month basic salary Year-end Bonus PhP 20,754 One-month basic salary Cash Allowance for Teachers PhP 3,500 PhP 3,500/year PhP 1,000 PhP 1,000/year (2019 GAA) World Teacher s Day Incentive Annual Medical Exam PhP 500 PhP 500/year (2019 GAA) Php 370,482 Total Annual C&B Php 30,873 Gross Monthly C&B DEPARTMENT OF EDUCATION DEPARTMENT OF EDUCATION
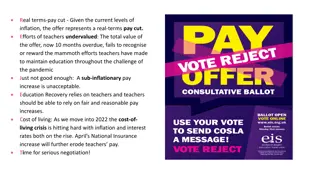
Others Amount 15-25% of basic salary Maximum 25% of basic salary Hardship Allowance Honoraria for teaching overload Basic compensation of Teacher I still falls within the income tax exemption threshold under TRAIN We have seen a trend of teachers travelling abroad on vacation Some LGUS also provide additional incentives/allowance to teachers from their general fund We have ongoing program to improve professional development and career progression system DEPARTMENT OF EDUCATION DEPARTMENT OF EDUCATION 5
Table 5. Average Monthly Salaries Of Teachers, Public Vs Private, By Region, 2016 (PhP) Public ES/HS Teachers 19, 566 19, 283 18, 802 19, 896 20, 454 19, 450 19, 090 20, 300 19, 449 19, 401 19, 416 19, 726 19, 542 20, 813 19, 326 20, 710 18, 947 17, 145 Private ES/HS Teachers 11, 416 14, 366 13, 143 8, 212 10, 181 10, 666 10, 451 9, 558 11, 584 10, 423 12, 148 13, 100 8, 085 14, 632 9, 762 9, 235 8, 157 6, 650 Region % Difference Philippines NCR CAR Region I (Ilocos Region) Region II (Cagayan Valley) Region III (Central Luzon) Region IV-A (CALABARZON) Region IV-B (MIMAROPA) Region V (Bicol Region) Region VI (Western Visayas) Region VII (Central Visayas) Region VIII (Eastern Visayas) Region IX (Zamboanga Peninsula) Region X (Northern Mindanao) Region XI (Davao Region) Region XII (SOCCSKSARGEN) Region XIII (Caraga) BARMM 71% 34% 43% 142% 101% 82% 83% 112% 68% 86% 60% 51% 142% 42% 98% 124% 132% 158% Source: Manasan, 2017 Data Sources: Labor Force Survey 2016 DEPARTMENT OF EDUCATION DEPARTMENT OF EDUCATION
")


 Compensation &")