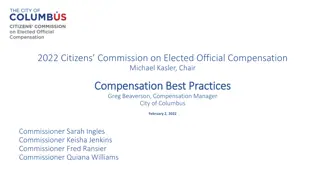
Furman University Compensation Study: Structure and Market Assessment

 undefined


FURMAN UNIVERSITY
Compensation Structure and
Merit Process - 2017


INTRODUCTION
Compensation Study
Salary Grades
Annual Increases
INTRODUCTION
In 2015, Furman University partnered with Towers
Watson, a global professional services firm to
perform a market assessment of jobs throughout
the organization.
The primary objectives were to assess the
competitiveness of Furman’s compensation levels,
and to establish market-based salary ranges for
jobs.
INTRODUCTION
Furman HR met with managers to determine appropriate
matches based on descriptions provided in the College
and University Professional Association (CUPA).
Additional survey matches were gathered by Towers
Watson using multidiscipline surveys from their own
organization and Mercer.
Salary data was compiled from these surveys, utilizing the
appropriate labor market.
MARKET DATA
Towers Watson provided market data for benchmark
positions. Standard market data control points include the
25
th
percentile, median and 75
th
percentile.
$20,000
$22,000
$24,000
$26,000
$28,000
$30,000
$32,000
$34,000
$36,000
25
th
percentile
Median
75
th
percentile
SALARY GRADES
Internally, Furman HR developed Salary Grades.
Salary grades are used to group jobs of similar responsibility, requirements,
experience level and market range data.
Grades have three control points:
Minimum,
Midpoint,
Maximum
SALARY GRADES (2016)
GRADE CHART
GRADE CHART – HOURLY RATE
GRADES – 2017
Grades will be updated at the start of the fiscal
year, July 1.
Grades will be adjusted 1.0% (rounded to the
nearest $100). The percentage is based on the
increase in the cost of living.
SALARY INCREASES
Salary increase percentages are based on three metrics:
Cost of Living
Employee Performance
Employee position within the salary grade
Furman has implemented a plan to address those employees who fall below
their grade minimum
For 2017, the cost of living and merit increase categories are combined.
NEW FOR 2017
Numeric Performance Ratings
NEW FOR 2017
NEW FOR 2017
Numeric Performance Ratings
Needs Improvement
Score 44 - 74
Accomplished
Score 75 - 114
Exemplary
Score 115 - 132
NEW FOR 2017
Cost of living and Merit Increase
categories combined into one merit pool.
NEW FOR 2017
Stipends for staff over grade maximum will be an
amount at managers’ discretion (within guidelines).
SALARY INCREASES
For employees
below
the salary grade minimum:
SALARY INCREASES
For employees
within
the salary grade:
SALARY INCREASES
For employees
above
the salary grade maximum:
SALARY GRADES (2017)
GRADE CHART
GRADE CHART – HOURLY RATE
Furman University partnered with Towers Watson in 2015 to assess the competitiveness of its compensation levels and establish market-based salary ranges. The study involved determining appropriate job matches, developing salary grades, and analyzing market data for benchmark positions. Internal salary grades were created to group jobs based on responsibility, requirements, and experience level, with control points at the minimum, midpoint, and maximum levels. The university's compensation structure and merit process were designed to align with industry standards and ensure fair and competitive pay for employees.

Download Presentation

Please find below an Image/Link to download the presentation.
The content on the website is provided AS IS for your information and personal use only. It may not be sold, licensed, or shared on other websites without obtaining consent from the author. Download presentation by click this link. If you encounter any issues during the download, it is possible that the publisher has removed the file from their server.
E N D
Presentation Transcript
FURMAN UNIVERSITY Compensation Structure and Merit Process - 2017
INTRODUCTION Compensation Study Salary Grades Annual Increases
INTRODUCTION In 2015, Furman University partnered with Towers Watson, a global professional services firm to perform a market assessment of jobs throughout the organization. The primary objectives were to assess the competitiveness of Furman s compensation levels, and to establish market-based salary ranges for jobs.
INTRODUCTION Furman HR met with managers to determine appropriate matches based on descriptions provided in the College and University Professional Association (CUPA). Additional survey matches were gathered by Towers Watson using multidiscipline surveys from their own organization and Mercer. Salary data was compiled from these surveys, utilizing the appropriate labor market.
MARKET DATA Towers Watson provided market data for benchmark positions. Standard market data control points include the 25thpercentile, median and 75thpercentile. Salary Data for Widget Maker $20,000 $22,000 $24,000 $26,000 $28,000 $30,000 $32,000 $34,000 $36,000 Median 25th percentile 75th percentile
SALARY GRADES Internally, Furman HR developed Salary Grades. Salary grades are used to group jobs of similar responsibility, requirements, experience level and market range data. Grades have three control points: Minimum, Midpoint, Maximum
SALARY GRADES (2016) 12 11 10 9 8 7 6 5 4 3 2 1 $18,000 $38,000 $58,000 $78,000 $98,000 $118,000 $138,000 $158,000
GRADE CHART Grade Min 20,000 23,000 26,500 30,000 34,600 40,100 45,700 53,000 61,400 70,200 81,800 95,300 Mid 25,000 28,800 33,100 38,200 44,100 51,200 59,300 68,900 79,900 93,000 108,400 126,300 Max 30,000 34,500 39,700 46,400 53,600 62,200 73,000 84,700 98,300 115,900 135,000 157,200 1 2 3 4 5 6 7 8 9 10 11 12
GRADE CHART HOURLY RATE Grade 1 2 3 4 5 6 7 8 9 10 11 12 Min Mid 12.02 13.85 15.91 18.37 21.20 24.62 28.51 33.13 38.41 44.71 52.12 60.72 Max 14.42 16.59 19.09 22.31 25.77 29.90 35.10 40.72 47.26 55.72 64.90 75.58 9.62 11.06 12.74 14.42 16.63 19.28 21.97 25.48 29.52 33.75 39.33 45.82
GRADES 2017 Grades will be updated at the start of the fiscal year, July 1. Grades will be adjusted 1.0% (rounded to the nearest $100). The percentage is based on the increase in the cost of living.
SALARY INCREASES Salary increase percentages are based on three metrics: Cost of Living Employee Performance Employee position within the salary grade Furman has implemented a plan to address those employees who fall below their grade minimum For 2017, the cost of living and merit increase categories are combined.
NEW FOR 2017 Numeric Performance Ratings
Accomplished Exemplary Needs Improvement Score 44 - 74 Score 75 - 114 Score 115 - 132 NEW FOR 2017 Numeric Performance Ratings
NEW FOR 2017 Cost of living and Merit Increase categories combined into one merit pool.
NEW FOR 2017 Stipends for staff over grade maximum will be an amount at managers discretion (within guidelines).
SALARY INCREASES For employees below the salary grade minimum: Performance Rating Base Salary Increase Accomplished (score 75 114) 6.00% Exemplary (score 115 132) 7.00%
SALARY INCREASES For employees within the salary grade: Discretionary Pool Of up to 4.00%
SALARY INCREASES For employees above the salary grade maximum: Performance Rating Base Salary Increase Accomplished (score 75 114) Up to 2.00% One Time Stipend Exemplary (score 115 132) Up to 2.50% One Time Stipend
SALARY GRADES (2017) 12 11 10 9 8 7 6 5 4 3 2 1 $18,000 $38,000 $58,000 $78,000 $98,000 $118,000 $138,000 $158,000
GRADE CHART Grade Min Mid 25,400 29,200 33,600 38,800 44,800 52,000 60,200 69,900 81,100 94,400 110,000 128,200 Max 30,500 35,000 40,300 47,100 54,400 63,100 74,100 86,000 99,800 117,600 137,000 159,600 1 2 3 4 5 6 7 8 9 10 11 12 20,300 23,300 26,900 30,500 35,100 40,700 46,400 53,800 62,300 71,300 83,000 96,700
GRADE CHART HOURLY RATE Grade 1 2 3 4 5 6 7 8 9 10 11 12 Min 9.76 11.20 12.93 14.66 16.88 19.57 22.31 25.87 29.95 34.28 39.90 46.49 Mid 12.21 14.04 16.15 18.65 21.54 25.00 28.94 33.61 38.99 45.38 52.88 61.63 Max 14.64 16.83 19.38 22.64 26.15 30.34 35.63 41.35 47.98 56.54 65.87 76.73


")


")