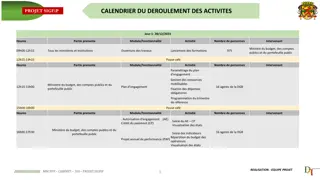
School Week Schedule and Activities
The agenda outlines the tasks and events for the upcoming school days. It includes homework assignments, test preparation, warm-up questions, class visit schedule, and an exit pass question relating to statistics. Grudgeball, a group activity involving solving problems for points, is also included in the plan. A detailed breakdown of each day's activities along with specific instructions and reminders are provided.

Download Presentation

Please find below an Image/Link to download the presentation.
The content on the website is provided AS IS for your information and personal use only. It may not be sold, licensed, or shared on other websites without obtaining consent from the author. Download presentation by click this link. If you encounter any issues during the download, it is possible that the publisher has removed the file from their server.
E N D
Presentation Transcript
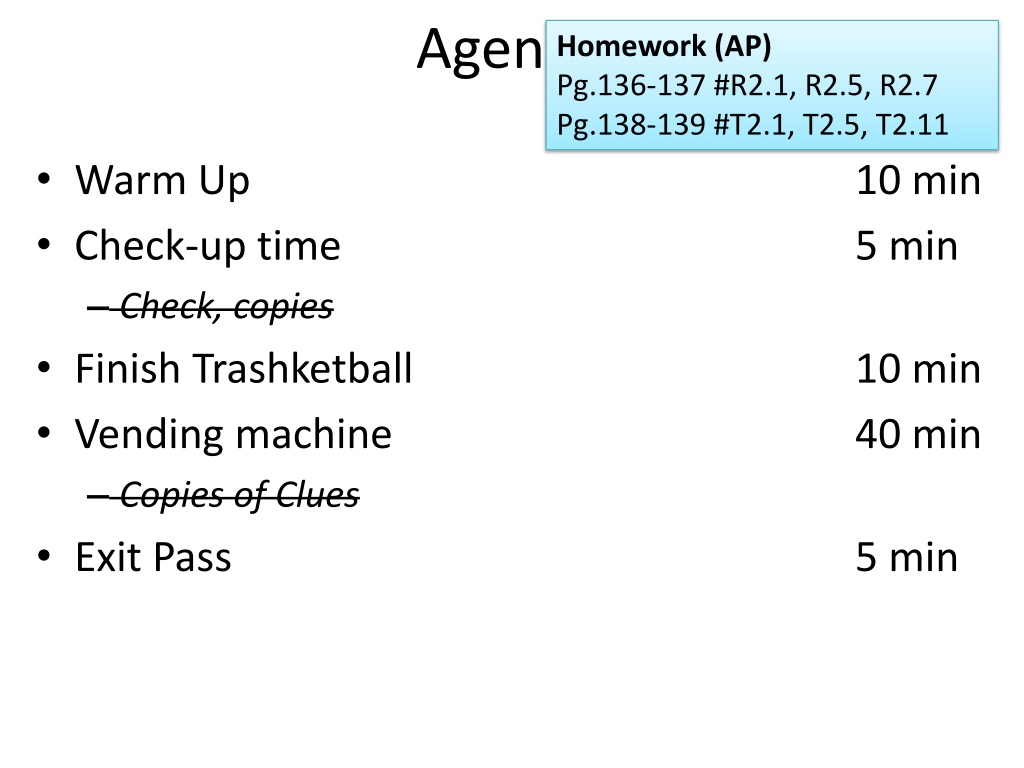
Agenda Homework (AP) Pg.136-137 #R2.1, R2.5, R2.7 Pg.138-139 #T2.1, T2.5, T2.11 Warm Up Check-up time Check, copies Finish Trashketball Vending machine Copies of Clues Exit Pass 10 min 5 min 10 min 40 min 5 min
Warm Up 1. Each SAT section is curved so the mean is 500 and =100. I want to be better than 90% of America. What do I need to score? 2. You will be taking a Chapter 2 test on Wednesday. Past scores on this test have mean 81% and =9.1%. Assuming your scores the same mean and standard deviation, what do you need to score on Wednesday s test in order to be in the top 1/3 of the class?
Warm Up 1. Each SAT section is Normally distributed with mean is 500 and =100. I want to be better than 90% of America. What do I need to score? 2. You will be taking a Chapter 2 test on Wednesday. Past scores on this test have been Normally distributed with mean 81% and =9.1%. Assuming your scores the same mean and standard deviation, what do you need to score on Wednesday s test in order to be in the top 1/3 of the class?
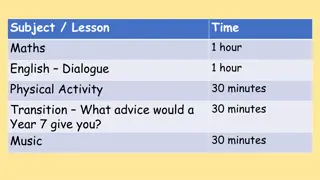
Tomorrow and Wednesday Tomorrow: I ll be visiting other classes for the first ~10 minutes. Period 1 Burton Period 3 VanBuskirk Do your Warm Up. Extra time? Start your practice test. Wednesday (test day) I won t be here. Sub is named Ms. Hurst. No Warm Up. She ll take attendance, then hand out tests. You ll need your z-chart and a calculator.
Fridays Exit Pass The heights of American men are approximately normally distributed, with a mean of =70 inches and a standard deviation of =3 inches. At what height is a man in the tallest 10% of American men?
Grudgeball Groups of 3. Everyone has a whiteboard. Assign group members to be A, B, or C. I will also give you a group number. Put that letter and your group number at the top of your whiteboard. I will put up a problem. Solve it on your whiteboard. Ask your group for help. Use your notes. I will call out a letter. Those group members show their whiteboards. One point for a correct answer. If correct, that person shoots for bonus points. One, or three, or four bonus points. Every group starts with 10 points. You can add points to your total, remove them from other groups, or both. Group totals must stay within 0 score 10. You must spend your points immediately. Shooting order is from left to right, highest score to lowest score. Winners +5 extra credit
Period 2 One Two Yuki Dip Jada Three Four Julia Gabby E. Angie Five Belinda Megan Levani Six Seven Eight Andrew Jack Elian
Period 3 One Ryan Sebastian Percy 10 Two Amaya Abril Linh 9 Three Pablo Justin Jessica 10 Four Tamila Jonathan Ariana 9 Five Jocelyn Sydney Bella 5 Six Jack Sosan Adam 8 Seven Dylan Julian Kamran 10
Investigations (generally) Groups of 3 Complicated problem, usually not right answer You don t have enough information. You need to ask me the right questions to get Clues. Write questions on whiteboard. Anyone can collect Clues, but choose a Writer to answer the Questions on their whiteboard.
Example: Fish Tank Mr. Colligan is filling an empty rectangular fish tank with water. Mr. Colligan is hungry. Does he have time to microwave a slice of leftover lasagna that he found in the fridge? Assume no extra travel time between the fish tank and the microwave. If yes How much extra time does he have? If no How much water has spilled on to the floor by the time the lasagna is done?
The Clues 1. Tank measurements: Height 6 inches Base length 3 feet Base width 1 foot 6 in. 36 in. 2. Water is filling the tank at 8 in3 per second. 3. The lasagna needs 5 minutes in the microwave.
The Vending Machine Problem I own a vending-machine company that exclusively dispenses coffee. I love the free coffee, but I m bad at my job. I have no idea how much coffee my machines should pour. I have hired you as consultants, to answer these questions: 1. Tell me the mean amount of coffee that my machines should dispense per cup. 2. Using that mean, what percentage of my customers will receive overflowing cups? 3. Using that mean, what will be my average profit per day? 4. Justify in detail why your answers to #1-3 are ideal. I have TEN Clues. You will need them all, eventually.
x Clues on next slide
1. Cups will hold up to 12 ounces. 7. My company spends $0.05 per serving of liquid coffee creamer. 2. The distribution is Normal. 3. The standard deviation of pours is 0.2 ounces. 8. Customers use an average of 1 creamer and 1.5 sugar packets. 4. A cup of coffee costs the customer $1.50. 9. My company spends $0.08 per ounce of coffee. 5. My company spends $0.10 for the cup, lid and sleeve. 10. On average, my company sells 215 coffees per day. 6. My company spends $0.07 per packet of sugar.
Window/Door No notes. Explain as simply as possible. 1. What is a z-score? 2. What is a percentile? 3. What is a density curve? 4. When do you subtract from 1, and why? 5. What is the most important part of this course? 6. What s a normal quantile plot, and how do you use it?
Homework (AP) Pg.136-137 #R2.1, R2.5, R2.7 Pg.138-139 #T2.1, T2.5, T2.11 Exit Pass Scores for the SAT math section are Normal with mean 500 and =100. What percentage of students receive the following scores? 1. 2. 3. 4. 500 or higher. At least 600. At least 700. A perfect 800. 5. Choose the one topic that you think you are worst at. A. B. C. D. Use z-scores to answer real-world questions. E. Everything, I m freaking out. F. Nothing, I m awesome. Normal quantile plot to assess Normality. Calculate z-scores using the formula. Use z-chart.


")


")