Soil Moisture-Atmosphere Interactions in the 2003 European Summer Heat Wave
This presentation discusses the significant impacts of soil moisture-atmosphere interactions during the 2003 European Summer Heat Wave, highlighting the abnormally hot weather, pavement buckling, and high-pressure systems that contributed to the extreme conditions. The images and diagrams illustrate the key concepts such as land-atmosphere interactions, soil moisture-evapotranspiration coupling, and specific events like the drying of the Loire River and low water levels in reservoirs. The study emphasizes the relationship between soil moisture, evapotranspiration, and heat fluxes in understanding heat wave dynamics and climate anomalies.

Download Presentation

Please find below an Image/Link to download the presentation.
The content on the website is provided AS IS for your information and personal use only. It may not be sold, licensed, or shared on other websites without obtaining consent from the author. Download presentation by click this link. If you encounter any issues during the download, it is possible that the publisher has removed the file from their server.
E N D
Presentation Transcript
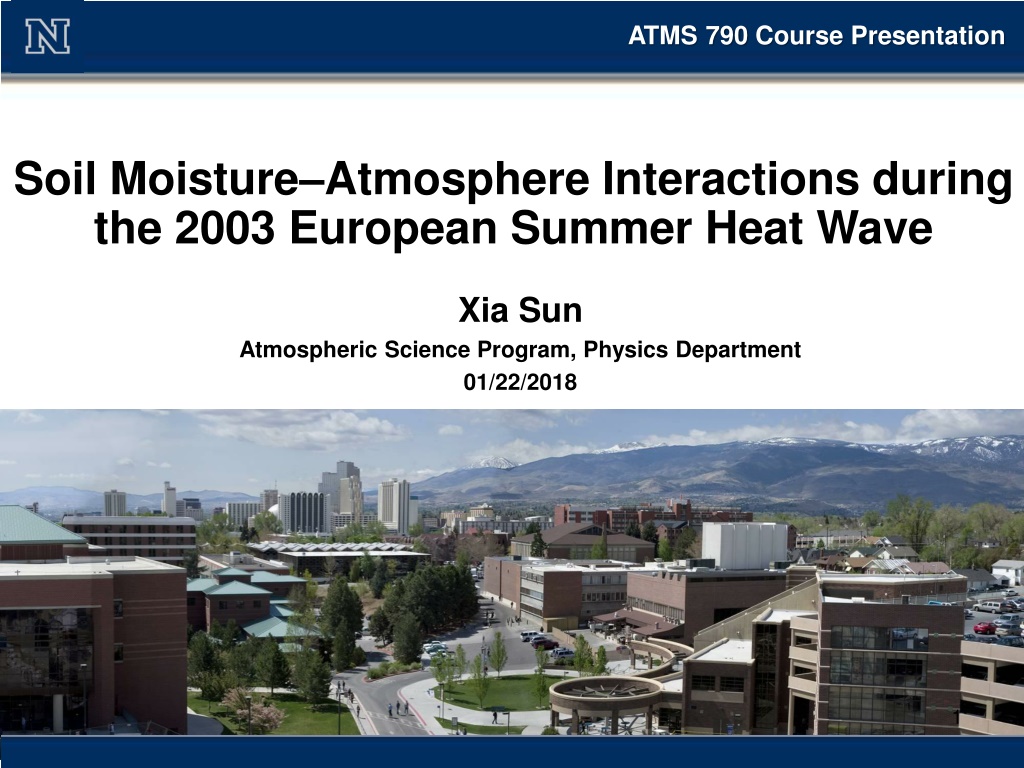
ATMS 790 Course Presentation Soil Moisture Atmosphere Interactions during the 2003 European Summer Heat Wave Xia Sun Atmospheric Science Program, Physics Department 01/22/2018 1
Motivation Heat Wave Abnormally hot weather lasting at least 2 days. Heat anomalies from June 17-24, 2012 2
Motivation Pavement buckled during the heat wave in Chicago, 2012 3
Motivation Heat Wave 4
Heat Wave High-pressure systems can create a 'cap' that traps air in one place as it warms 5
Land-atmosphere Interaction dS/dt is the change of water content within the given layer P is the precipitation E is the evapotranspiration Rs is the surface runoff, Rg is the drainage dH/dt refers to the change of energy within the same layer Rn is net radiation E is the latent heat flux SH is sensible heat flux G is ground heat flux (Seneviratne et al. 2010) 6
Soil moistureevapotranspiration coupling Three regimes Evaporation Fraction Definition of soil moisture regimes and corresponding evapotranspiration regimes (Seneviratne et al. 2010) 7
2003 European Summer Heat Wave July to August 2003 Dates Mostly Western Europe (France most) Areas affected The hottest summer on record since 1954 8
2003 European Summer Heat Wave Loire river almost dry near Nevers, France 9
2003 European Summer Heat Wave Low water level in Haweswater Reservior UK, September 2003 10
2003 European Summer Heat Wave More than 3.0SD above the mean of climatology average 1000 500 mb thickness temperature anomaly for June, July, and August 2003 relative to 1979-2003. 11
Model Components Climate High-Resolution Model (CHRM) version 2.3 Convection scheme Kessler-type microphysics Land-surface scheme Soil thermal model Radiative transfer model Horizontal resolution: 56 km Vertical resolution: 20 layers 12
Model Sensitivity Experiments Climate High-Resolution Model (CHRM) version 2.3 France Climatology mean: CLIM Control run: CTL (reference run) Soil moisture sensitivity experiments: dry and wet 10%, 15%, 20%, 25%, or 50% 13
Validation of CTL (control) simulation Temperature Observation CTL-CLIM Warm anomaly Summer (JJA) 2003 temperature anomaly with respect to the reference period 1970 2000 14
Validation of CTL (control) simulation Precipitation CTL-CLIM Observation Precipitation deficit Summer (JJA) 2003 precipitation anomaly with respect to the reference period 1970 2000 15
Soil moisture evolution Higher due to precipitation in summer and autumn of 2012 Wet runs Soil moisture deficit starts in June CTL Soil moisture deficit starts in Mar Semimonthly 2003 soil moisture depth averaged over France for sensitivity experiments 16
Soil moisture evolution (August) Aug 2003 soil moisture content in the CTL, DRY25, and WET25 simulations, respectively, divided by the climatological mean (CLIM, 1970 2000) for the corresponding month 17
Temperature Response April-May June-August Scatterplot between JJA 2003 surface temperature and soil moisture Semimonthly 2003 temperature at 2 m averaged over France Quasi-linearly relation: gradient - 0.0015 K mm-1 18
Temperature Response Low sensitivity in Dry Iberian Peninsula Summer 2003 temperature anomaly due to spring soil moisture perturbation 19
Precipitation Response Non-linear relation Scatterplot between JJA 2003 precipitation and soil moisture Semimonthly 2003 precipitation averaged over France Dry limited evaporation reduced convective activity 20
Circulation Response - Geopotential Height Geopotential Height the actual height of a pressure surface above mean sea-level heights are lower in cold air masses, and higher in warm air masses Surface heat low Caused by intense surface heating 21
Circulation Response Geopotential height CTL-CLIM DRY25-CTL WET25-CTL 500 hPa High pressure anomaly and classic wave pattern 1000 hPa Weak anomaly due to strong surface heating causing surface heat low Surface heat low 22
Surface Energy Balance Net radiation = latent heat flux + sensible heat flux + ground heat flux Clear skies Back to climatology mean This heat wave is not caused by abnormal high net radiation 23
Surface Energy Balance LH negative anomaly of the control run 24
Soil moisture and PBL height (WRF model results, 30 May 3 June 2010) Soil moisture (%) PBL height (m) Sensible heat flux (W m-2) (Z. Tao et al. 2013) 25
Conclusion Anomalous atmospheric circulation and the anomalous dry continental-scale soil contribute to the heat wave Partitioning of net radiation in latent and sensible heat fluxes has strongly contributed to the extreme August temperatures. Soil moisture perturbations can affect continental-scale circulation 26
Leisure during Heat Wave Mahjong 27


 simulation Temperature")
 simulation Precipitation")

")