Understanding Soil and Foundation Engineering Fundamentals
Soil plays a crucial role in engineering, with unique properties that influence its mechanical behavior. This article covers the formation of soil, types including residual and transported soils, and the phases of soil in nature. Explore phase diagrams, relationships between volume, void ratio, and porosity to gain insights into soil mechanics.

Download Presentation

Please find below an Image/Link to download the presentation.
The content on the website is provided AS IS for your information and personal use only. It may not be sold, licensed, or shared on other websites without obtaining consent from the author. Download presentation by click this link. If you encounter any issues during the download, it is possible that the publisher has removed the file from their server.
E N D
Presentation Transcript
Soil and Foundation Engineering Unit 1 - Unit 3
Introduction The term "soil" can have different meanings, depending upon the field in which it is considered. To a geologist, it is the material in the relative thin zone of the Earth's surface within which roots occur, and which are formed as the products of past surface processes. The rest of the crust is grouped under the term "rock". To a gedologist, it is the substance existing on the surface, which supports plant life. Soil consists of a multiphase aggregation of solid particles, water, and air. This fundamental composition gives rise to unique engineering properties, and the description of its mechanical behaviour requires some of the most classic principles of engineering mechanics
Formation of soil soils originate, directly or indirectly, from different rocks. conditions that formed soil is Breakdown of parent rock: weathering, decomposition, erosion. Transportation to site of final deposition: gravity, flowing water, ice, wind. Environment of final deposition: flood plain, river terrace, glacial moraine, lacustrine or marine.
Type of soils (1) Residual soils (2) Transported soils
Residual Residual Soils & Transported Soils Soils & Transported Soils Residual Soils Residual soils are found at the same location where they have been formed. Transported Soils Weathered rock materials can be moved from their original site to new locations by one or more of the transportation agencies to form transported soils. Transported soils further can be classified as a) alluvial deposits. b) lacustrine deposits. c) marine deposits. d) glacial deposits. e) aeolian deposits.
Phase Diagram of Soils Phase Diagram of Soils Soils, as they exist in nature, consist of solid particles (mineral grains, rock fragments) with water and air in the voids between the particles. The relative proportions of the three phases(soilds , air & water) vary in soil deposits, We consider a soil model which will represent all the these phases properly quantify the amount of each phase in terms of weight and volume symbols respectively for soil solids, water, and air.
Phase Diagram Phase Diagram
Relationships B/W Volume Void ratio (e) is the ratio of the volume of voids (Vv) to the volume of soil solids (Vs), and is expressed as a decimal. e= Vv/Vs Porosity (n) is the ratio of the volume of voids to the total volume of soil (V ), and is expressed as a percentage n=Vv/V The volume of water (Vw) in a soil can vary between zero (i.e. a dry soil) and the volume of voids. This can be expressed as the degree of saturation (S) in percentage S=Vw/Vv Air content (ac) is the ratio of the volume of air (Va) to the volume of voids. ac= Va/Vv Percentage air voids (na) is the ratio of the volume of air to the total volume. na=Va/V
Relationships B/W weights The ratio of the mass of water present to the mass of solid particles is called the water content (w), or sometimes the moisture content. The mass of solid particles is usually expressed in terms of their particle unit weight or specific gravity (Gs) of the soil grain solids . Dry unit weight Bulk unit weight Saturated unit weight Buoyant unit weight or submerged unit weight
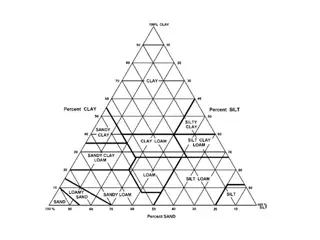
Soil Classifications The relevant criteria for classifying soils are the size distribution of particles and the plasticity of the soil.
Particle Size Distribution Particle Size Distribution The particle size distribution of soils can be conducted in following manner Wet sieving is carried out for separating fine grains from coarse grains by washing the soil specimen on a 75 micron sieve mesh. Dry sieve analysis is carried out on particles coarser than 75 micron. Samples (with fines removed) are dried and shaken through a set of sieves of descending size. The weight retained in each sieve is measured. The cumulative percentage quantities finer than the sieve sizes (passing each given sieve size) are then determined. The resulting data is presented as a distribution curve with grain size along x-axis (log scale) and percentage passing along y-axis (arithmetic scale). Sedimentation analysis is used only for the soil fraction finer than 75 microns. Soil particles are allowed to settle from a suspension. The decreasing density of the suspension is measured at various time intervals. The procedure is based on the principle that in a suspension, the terminal velocity of a spherical particle is governed by the diameter of the particle and the properties of the suspension. In this method, the soil is placed as a suspension in a jar filled with distilled water to which a deflocculating agent is added. The soil particles are then allowed to settle down. The concentration of particles remaining in the suspension at a particular level can be determined by using a hydrometer. Specific gravity readings of the solution at that same level at different time intervals provide information about the size of particles that have settled down and the mass of soil remaining in solution. The results are then plotted between % finer (passing) and log size.
Grain Grain- -Size Distribution Curve Size Distribution Curve Size distribution curves, as obtained from coarse and fine grained portions, can be combined to form one complete grain-size distribution curve .
Grading Characteristics Grading Characteristics D60= size at 60% finer by weight D30= size at 30% finer by weight D10= size at 10% finer by weight The grading characteristics are then determined as follows: 1. Effective size = D10 2. Uniformity coefficient all should be taken form grading size distribution curve 3. Curvature coefficient,
Cont. Grading Characteristics Grading Characteristics If Cu> 5then soil is well-graded soil, i.e. a soil which has a distribution of particles over a wide size range. If Cclies between 1 and 3 also indicates a well-graded soil. If Cu< 3 then soil is uniform soil, i.e. a soil which has a very narrow particle size range.
Consistency of Soils Consistency of Soils A gradual increase in water content causes the soil to change from solid to semi-solid to plastic to liquid states. The water contents at which the consistency changes from one state to the other are called consistency limits (or Atterberg limits). The three limits are known as the shrinkage limit (WS), plastic limit (WP), and liquid limit (WL) as shown. The values of these limits can be obtained from laboratory tests.
Indian Standard Soil Classification System Very coarse soils Boulder size > 300 mm Cobble size 80 - 300 mm Coarse soils Gravel size (G) Coarse Fine 20 - 80 mm 4.75 - 20 mm Sand size (S) Coarse Medium 2 - 4.75 mm 0.425 - 2 mm Fine 0.075 - 0.425 mm Fine soils Silt size (M) 0.002 - 0.075 mm Clay size (C) < 0.002 mm
Assignment 1. Write the importance of soil classification . 2. What do you mean by Atterberg s limit ? Also give the names of apparatus used to determine the limits
Refrences www.nptel.ac.in Google Wikipedia