Exploring Plant Traits: Do Plants Exhibit Variation in Traits?
Discover in this lesson whether plants display variations in traits through the measurement of plant lengths. Students analyze data tables of carrots and leaves to observe trait variations and discuss patterns found in bar graphs and data tables. The focus is on understanding how to identify and interpret trait variations in different plant species.

Download Presentation

Please find below an Image/Link to download the presentation.
The content on the website is provided AS IS for your information and personal use only. It may not be sold, licensed, or shared on other websites without obtaining consent from the author. Download presentation by click this link. If you encounter any issues during the download, it is possible that the publisher has removed the file from their server.
E N D
Presentation Transcript
VARIATION IN TRAITS LESSON 2B Do Plants Show Variation in Traits? How Do We Know?
Review: Plant Traits and Variation How did you complete this statement in our last lesson? Plants [show/do not show] variation in their traits. My evidence is __________. What plant trait did you measure? What is a variation in a trait? How does measuring help us find out whether there s variation in a trait?
Our Focus Questions Do plants show variation in traits? How do we know?
Our Plant Data Choose one member from your small group to add your data to the class data table for your plant. Plant length should be measured to the nearest quarter of an inch. Place an X next to the measurement on the table that matches the length of each plant in your group. Length Tally Marks 2 inches 2 inches 2 inches 2 inches X 3 inches XXX 3 inches 3 inches X 3 inches 4 inches
Is There Variation in the Length Trait? Look at the data tables for the carrots and the leaves. Discuss in your small group whether the length trait shows variation for each kind of plant. Do you observe variation in the length trait for carrots? How can you tell? Do you observe variation in the length trait for leaves? How can you tell?
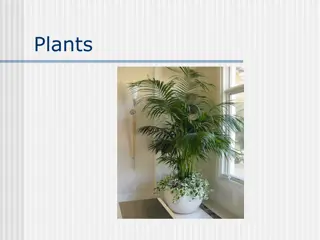
Trait Variation in Other Kinds of Plants Talk with an elbow partner and come up with two more traits that plants have. Then think of another kind of plant and decide whether it shows variation for those traits? Photo courtesy of Wikimedia.com Photo courtesy of Pixabay.com Photo courtesy of Pixabay.com
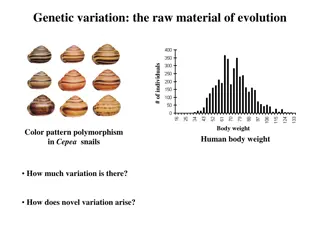
Finding Patterns in Our Data What patterns did we observe in our class bar graph showing the number of ladybug spots? What patterns did we observe on our class data tables showing the length of carrots and leaves?
Bar Graphs and Data Tables Think about the bar graph and data tables we used to organize our data. How are a bar graph and a data table alike and different? Do both ways of organizing data help us find patterns? Do both show evidence of variation in traits of living things of the same kind? In what ways?
More or Less Trait Variation? Do you see more or less trait variation for the number of spots on the ladybugs? What is your evidence? Do you see more or less trait variation for the length of the carrots? What is your evidence? Do you see more or less trait variation for the length of the leaves? What is your evidence?
Lets Summarize! Today s focus questions: Do plants show variation in traits? How do we know? To summarize what you ve learned about variation in traits, answer these revised focus questions in your notebook: Do plants and animals of the same kind show variation in traits? How do we know? Include evidence from our investigations of the ladybugs, carrots, and leaves. Make sure to use the words trait and variation in your responses.
Next Time In our next lesson, we ll explore how traits affect beetles and their chances of surviving in the desert. Photo courtesy of Wikimedia.com Photo used with permission from BSCS We ll also gather more information to help us answer our unit central question.