Deconvolving Snow Cover and Snowfall Passive Microwave Signals
This research focuses on deconvolving snow cover and snowfall passive microwave signals using GPM data. The study employs a data-driven approach to estimate snowfall using a nested K-nearest algorithm and observed irregularities. By analyzing variations in brightness temperatures (Tbs) over snow-covered surfaces and investigating the effects of skin temperature on snowfall scattering, the study aims to enhance snow cover detection and snowfall estimation. The proposed approach involves removing skin temperature effects, analyzing Tbs variations with snow water equivalent (SWE) for different snowfall intensities, and calculating clear-sky emissivity variations over snow cover. Findings suggest distinct differences in Tbs patterns with varying SWE and liquid water path (LWP), highlighting the challenge of separating signals influenced by skin temperature from those affected by snowfall.
Download Presentation

Please find below an Image/Link to download the presentation.
The content on the website is provided AS IS for your information and personal use only. It may not be sold, licensed, or shared on other websites without obtaining consent from the author. Download presentation by click this link. If you encounter any issues during the download, it is possible that the publisher has removed the file from their server.
E N D
Presentation Transcript
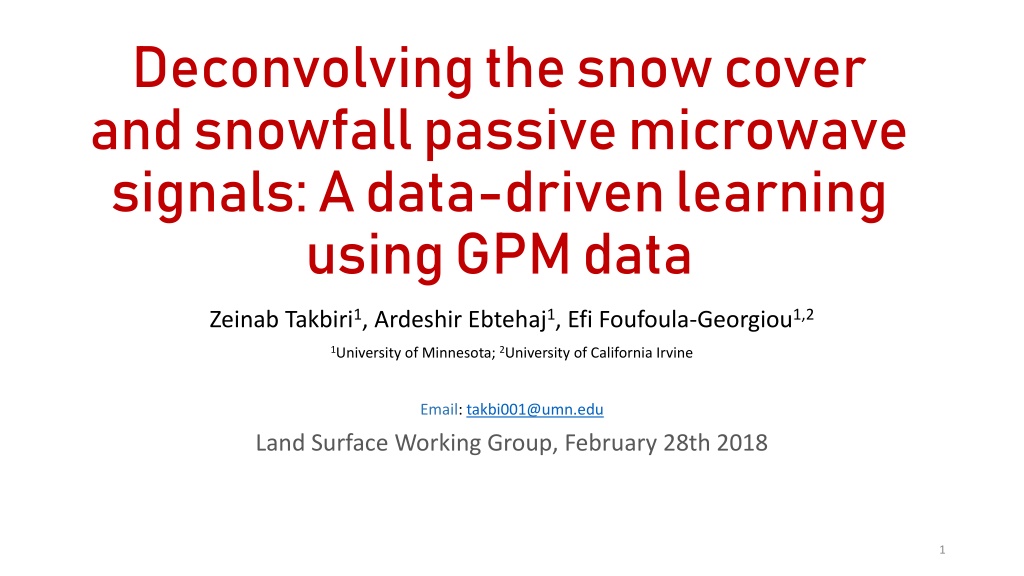
Deconvolvingthe snow cover and snowfall passive microwave signals: A data-driven learning using GPMdata Zeinab Takbiri1, Ardeshir Ebtehaj1, Efi Foufoula-Georgiou1,2 1University of Minnesota; 2University of California Irvine Email: takbi001@umn.edu Land Surface Working Group, February 28th 2018 1
Snowfall estimation: A nested K-nearest algorithm and an observed irregularity Winter Summer Seasonal precipitation phase probabilities by, REF (merged GPM active and passive products), and the presented KNN approach. The phase of REF (g & h), KNN (i & j), and their phase differences (k & l) Irregularity Zeinab Takbiri, Ardeshir Ebtehaj, Efi Foufoula-georgiou, Pierre-emmanuel Kirstetter , and F. Joseph Turk, A Prognostic Retrieval Approach for Microwave Precipitation Phase Detection over Snow Cover (under review AMS) 2
Database Passive and active microwave observations from GPM to have the overlapped brightness temperatures and snowfall intensities. Snow water equivalent (SWE) from MERRA-2. Snow cover presence or absence from AutoSnow. Total cloud liquid water path (LWP), vapor water path (VWP), 2-meter, and skin temperature (Ts) from both MERRA-2 and ECMWF. 3
Tb variations over snow-covered surfaces The bowl shape of Tbs as SWE increases matches with the previous studies on SWE analysis such as Rosenreid and Grody (2000). However, the pattern of increase and decrease in Tbs with the increase in LWP emission and SWE scattering also follow the pattern of skin temperature variations. 4
The Skin temperature variations with the increase of SWE and LWP The LWP and skin temperature snow cover with and without snowfall is very different. Thus, it is almost impossible to find enough data binned over both SWE and LWP for a small enough skin temperature interval to avoid its effects on brightness temperatures. 5
Our approach: Deconvolution Remove the Skin temperature effects Snowfall scattering on top of snow cover Analyzing the variations of Tbs with SWE for different snowfall intensities compared to those Tbs with no precipitation over the snow cover. Tb(???=0)= ????? ?? (???>0) Analyzing the Tb variations over the snow- covered surfaces (with no precipitation) with increase of SWE and LWP as a parameter Calculating the variations of clear-sky emissivity of snow cover with increase of SWE 6
Clear-sky emissivity: to remove the skin temperature effects Clear sky brightness temperature observations over the snow- covered surfaces: LWP = 0 (with both MERRA-2 and ECMWF) and the total integrated precipitable liquid and ice water = 0. ?????= ??/?? The total emissivity decreases with the increase of SWE is larger for lower-frequency compared to the high-frequency channels. As the SWE increases, the emissivity of 166 and 183 7 GHz channels is decreasing with a lower rate compared to the emissivity of 89 GHz. 7
The combined effects of LWP and SWE when there is no precipitation in the sky Emissivity (clear-sky) Skin temperature Not considering the effects of skin temperature increases in Tb variations might end up in over-estimation of the effects of LWP emission over the snow cover. The center of each path indicates the amount of increase in Tb at a fixed LWP interval and and a skin temperature. 1. 2. 3. For example at channel 89, 166, and 183 7 GHz: Tb LWP = 10 &Ts = 270.5K 12, 10, and 2K Tb LWP = 50 &Ts = 272.1K 15, 12, and 2.1K Tb LWP = 150 &Ts = 272.9K 19, 15, and 3 K 8
The snowfall scattering at different intensities over the snow cover Tb = ??? ??,???,???,?? We can now decode the effects of SWE vs snowfall scattering atchannel 89, 166, and 183 7 GHz:At SWE < 90 gm 2, the Tb = ?? ?? > 0 ?? ?? = 0 1. 1. ?? ?? = ? ?.? ???? ? ??, ??, ?? 2. 2. ?? ?? = ?.? ?.? ???? ? ??, ??, ?? 3. 3. ?? ?? = ?.? ?.? ???? ? ??, ??, ?? Channel 183 7 GHz could separate the snowfall from no snowfall signal over the snow cover but it is not sensitive to the amount of snowfall intensities. Channel 166 GHz demonstrates higher sensitivity to the snowfall scattering when the SWE values are small (<~100 ??? 2), as the Tb(SWE) is smaller than the Tb because of the snowfall scattering. The Tb due to the emission of LWP 150?? 2 is almost equal to or greater than the decrease of Tb with the scattering of snowfall at intensities 4 ?? ? 1, thus could easily mask the scattering of snowfall with small intensities. And this is where the snow cover signal might get confused with the snowfall signal on top the snow cover. 9
