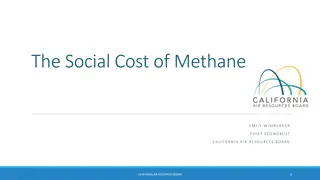
Analysis of SCE Summer Discount Plan 2015 Impact Estimates

The SCE Summer Discount Plan (SDP) for 2015 involved over 305,000 residential participants and 11,000 commercial participants, offering various cycling strategies to curtail air conditioning usage. Impact estimates were developed using matched control groups and a difference-in-differences approach. Ex-post impacts showed significant load reductions during peak hours. Residential and commercial customers provided MW reductions on specific days. The program's reliability and availability for dispatch were monitored for economic events. The methodology and outcomes of the SDP are detailed in the analysis.

Download Presentation

Please find below an Image/Link to download the presentation.
The content on the website is provided AS IS for your information and personal use only. It may not be sold, licensed, or shared on other websites without obtaining consent from the author. Download presentation by click this link. If you encounter any issues during the download, it is possible that the publisher has removed the file from their server.
E N D
Presentation Transcript
SCE Summer Discount Plan 2015 Ex Post and Ex Ante Impact Estimates Prepared by: Aimee Savage May, 2016
Program Description The SCE Summer Discount Plan (SDP) uses direct load control of central air conditioning to curtail residential and commercial usage on DR event days. Participants earn a bill credit throughout the summer months based on which cycling option they select. Events are called within load control groups where DR is needed not all customers are called for every event. The residential program has over 305,000 participants and offers two cycling strategies. 30 residential SDP events were called in 2015 Number of Customers % of AC % of AC Tonnage Cycling Strategy Customers Tonnage 100% 50% All 270,890 34,821 305,711 89% 11% 100% 1,145,437 144,911 1,290,348 89% 11% 100% The commercial program has over 11,000 participants and offers three cycling strategies. 16 commercial SDP events were called in 2015 Number of Customers 949 2,770 7,749 11,468 % of AC % of AC Tonnage 8% 27% 65% 100% Cycling Strategy Customers 8% 24% 68% 100% Tonnage 35,173 118,798 287,961 441,933 30% 50% 100% All 2
Program Description 2015 Hours of Actual Use No. of Actual Dispatches Hours of Availability Available for Dispatch Reliability Events = Year Round 24/7 Economic Events = All Non-SCE Holiday Weekdays, up to 4 hours, no more than 3 consecutive days 180 hours annually 35 30 3
Ex Post Methodology Impact estimates were developed using a matched control group Two different control groups were assembled: one for the commercial SDP population and one for the residential SDP population. The control groups were selected using a propensity score match to find customers who had load shapes most similar to SDP customers on hot, non-event weekdays. Matching was performed within specific customer segments (weather station, industry, etc.). A difference-in-differences approach was used by subtracting the difference between the control and treatment customers on the hot non-event days from the difference between the groups on event days. Residential Matched Control Group on Hot, Non-Event Weekdays Treatment Control 2.5 2 1.5 kW 1 0.5 0 1 3 5 7 9 11 13 15 17 19 21 23 Hour Ending 4
Ex Post Impacts During the SCE system peak, September 8 from 4 to 5 PM, residential customers provided 347 MW and commercial customers provided 74 MW The temperature reached over 98 degrees Fahrenheit during this hour SDP events are dispatched locally and not all customers were called on this day There were no SDP events during the CAISO peak on September 10 Residential Commercial 450 400 350 300 250 MW 200 150 100 50 0 8-Sep 5
Ex Post Impacts On September 9, 2015, SCE called all residential and commercial customers on SDP from 4 to 8 pm From 5 to 6 PM, the entire SDP program delivered a 382 MW load reduction Most of the load impacts came from residential SDP customers with the 100% cycling option 6
Ex Post Impacts (Residential) September 9 was a territory-wide residential SDP event. Approximately 296,700 participants provided an aggregate impact of 291.5 MW. The average customer reduced demand by 0.98 kW during event period (4 to 8 PM). Load w/o DR (kW) Load w/ DR (kW) Impact CI Impact (Lower) CI Impact (Upper) 3.50 3.00 2.50 2.00 kW 1.50 1.00 0.50 0.00 0 3 6 9 12 15 18 21 24 Hour Ending 7
Ex Post Impacts (Commercial) September 9 was a territory-wide commercial SDP event. Approximately 11,500 participants provided an aggregate impact of 63.1 MW. The average customer reduced demand by 5.51 kW during event period (4 to 8 PM). Load w/o DR (MW) Load w/ DR (MW) Impact CI Impact (Lower) CI Impact (Upper) 700.00 600.00 500.00 400.00 MW 300.00 200.00 100.00 0.00 0 3 6 9 12 15 18 21 24 Hour Ending 8
Ex Ante Methodology At a high level, ex ante impact estimates for SDP were developed using the following multi-step process: First, ex post estimates were developed for SDP customers for 2015 using the matched control group methodology Second, regression models were estimated that relate ex post load impacts in each hour from 4 to 8 pm to average temperatures from midnight to the hour of interest (referred to as mean17, mean18, and so on) on the event day. Separate models were estimated for each AC cycling strategy, hour, and demand category (for commercial customers). Third, ex ante weather conditions were used as input to the regression models to predict impacts for each hour for monthly system peak days from January through December and for the typical event day. A similar method was used to estimate reference loads. Finally, ex ante impact estimates were adjusted to apply to the RA window from 1 to 6 pm for the summer and 4 to 9 pm for the winter. 9
Ex Ante Methodology There were slight differences between the ex ante methodology for residential and control customers (customer segmentation, for example) The scatterplot below illustrates the ex ante model for residential customers (ex post impacts vs. Mean17) 100 50 2 1.5 kW Impact 1 .5 0 70 80 90 100 70 Mean17 80 90 100 C-1 L C-2 N C-3 NW C-4 W H Graphs by new_cycl_pct_val 10
Enrollment Forecast Enrollment in the residential and commercial SDP programs are expected to decline somewhat sharply between 2016 and 2026 Residential enrollments are expected to fall from 275k to about 65k from 2016 to 2026 Commercial enrollments are expected to fall from 11.6k to 4.2k from 2016 to 2026 Residential Commercial 350,000 300,000 250,000 Enrolled Customers 200,000 150,000 100,000 50,000 0 2016 2017 2018 2019 2020 2021 2022 2023 2024 2025 2026 11
Ex Ante Impacts (1-in-2 SCE Weather) Per-customer impacts are assumed to remain the same from year to year Aggregate impacts will decrease sharply from 2017 to 2026 due to decrease in enrollment Expected impacts are similar under CAISO weather conditions, and slightly higher under 1-in-10 weather year conditions Residential Commercial kW Impact per Customer 400.0 Program Year Aggregate MW Impact Group Enrollment 350.0 300.0 MW Impact 250.0 2015 Ex Post 11,473 5.48 62.9 200.0 Commercial 2017 10,662 4.58 48.9 150.0 2026 4,267 4.58 19.6 100.0 0.97 287.8 2015 Ex Post 296739 50.0 Residential 2017 242,268 0.86 207.2 0.0 2015 Ex Post 2017 2026 2026 65,578 0.86 56.1 12
Ex Ante Impacts (Residential) Residential ex ante impacts range from 0.00 kW per customer in the winter months to 1.00 kW per customer in August of a 1-in-10 weather year under SCE conditions. 1-in-2 1-in-10 1.20 1.00 kW Impact Per Customer 0.80 0.60 0.40 0.20 0.00 13
Ex Ante Impacts (Commercial) Commercial ex ante impacts range from 0.00 kW per customer in January and December to 6.20 kW per customer in September of a 1-in-10 SCE weather year. 1-in-2 1-in-10 7.00 6.00 Kw Impact Per Customer 5.00 4.00 3.00 2.00 1.00 0.00 14
Recommendations and Conclusion SCE called SDP for 30 residential events and 16 commercial events in 2015 from June 30 to October 9. Many of these events were called for specific load control groups that delivered load reductions in a specific area of need on a given day. All of these events occurred between 4 pm and 8 pm. However, the summer hours for which ex ante impacts are estimated range from 1 to 6 pm. Given that SDP is a large resource that has flexible event hours, can be dispatched locally and meets the increasing need for system resources during the late afternoon/early evening hours, the ex ante estimates from 1 to 6 pm may not reflect the overall value of the program. Therefore, Nexant recommends that stakeholders consider the flexibility of this resource to meet the evolving needs of SCE and the system operator (CAISO) when assessing the overall value of this program. 15
For comments or questions, contact: Aimee Savage Consultant asavage@nexant.com Josh Schellenberg Vice President jschellenberg@nexant.com Nexant, Inc. 101 2nd St., 10th Floor San Francisco, CA 94105 415-369-1000 16


")
")


")
")
")