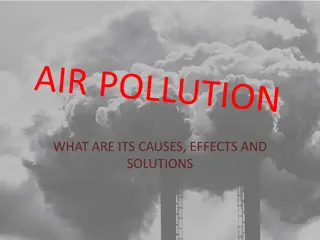
Addressing Air Pollution Challenges in India: Strategies and Solutions
Indian cities, both urban and rural, face high levels of PM2.5 pollution, impacting air quality and health. Effective solutions, requiring regional cooperation, must target all emission sources including household fuel combustion and waste management. Regional coordination between cities and states is vital for successful air quality management.

Download Presentation

Please find below an Image/Link to download the presentation.
The content on the website is provided AS IS for your information and personal use only. It may not be sold, licensed, or shared on other websites without obtaining consent from the author. Download presentation by click this link. If you encounter any issues during the download, it is possible that the publisher has removed the file from their server.
E N D
Presentation Transcript
Pathways towards clean air in India Pallav Purohit IIASA Air Quality and Greenhouse Gases Program EGU 2019 Vienna, April 11, 2019
Fine particulate matter (PM2.5) concentration in Indian cities 200 173 PM2.5concentration (annual average, g/m3) 172 180 160 149 146 144 143 138 140 131 120 120 120 105 101 98 100 84 74 80 65 64 60 60 NAAQS 40 20 WHO guideline 0 Source: WHO (2018)
The study tools The GAINS (Greenhouse gas - Air Pollution INteractions and Synergies) and GCAM-IIMA models Energy activity projections GCAM/IIMA Decision making on air National emission ceilings quality management Buildings Emission control options: ~1000 measures, co-control of 10 air pollutants and 6 GHGs) Industry Transport Emissions Costs Optimization Atmospheric dispersion Health, ecosystems and climate impact indicators Policy targets
Air quality management needs to address urban and rural areas Computed ambient levels of PM2.5 Satellite-derived PM2.5 Emission densities of PM2.5, 2015 PM2.5 (kt/year) Source: NASA Source: IIASA/GAINS Source: IIASA/GAINS While current ambient PM2.5 monitoring in India reveals high levels in urban areas, remote sensing, comprehensive air quality modelling and emission inventories suggest large-scale exceedances of the NAAQS also in rural areas. Household fuel combustion, small industries, burning of garbage and agricultural waste, etc., cause high emissions in rural areas too. Pollution from rural areas is transported into the cities (and vice versa), where it constitutes a significant share of pollution.
Effective solutions require regional cooperation between cities and States Origin of (population-weighted) PM2.5 concentrations in ambient air 2015 120 A large share of PM2.5 in ambient air originates from sources outside of cities and from other States, which are beyond the immediate jurisdictions of cities. 100 PM2.5( g/m ) 80 60 NAAQS 40 WHO 20 guideline (Cost-)effective strategies require regionally coordinated approaches, and need to address urban and rural emission sources. 0 Natural sources Outside India Other India Neighboring States This State Source: IIASA/GAINS
Effective solutions must address all sources that contribute to PM2.5 formation A significant share of emissions still originates from sources associated with poverty and underdevelopment (i.e. solid fuel use in households and waste management practices). 120 100 PM2.5( g/m ) 80 60 NAAQS 40 Any effective reduction of PM2.5 levels in ambient air and the resulting health burden needs to balance emission controls across all these source sectors. WHO 20 guideline 0 Andhra Pradesh** Punjab Kerala Delhi Haryana Tamil Nadu Jharkhand Bihar Karnataka Rajasthan Odisha Maharashtra North East Goa Himachal Pradesh Uttar Pradesh Gujarat Uttarakhand Madhya Pradesh Assam West Bengal Chattisgarh Jammu, Kashmir A focus on single sources alone will not deliver effective improvements and is likely to waste economic resources to the detriment of further economic and social development. Natural sources Secondary PM2.5* Power stations Other high stacks Households Transport Waste Agriculture Other Source: IIASA/GAINS *Secondary particles formed in the atmosphere from agricultural NH3 emissions through chemical reactions with SO2 and/or NOx emissions; **Including Telangana
Macro-economic development and energy consumption 120 1000% 100 800% relative to 2015 80 600% EJ/year 60 400% 40 200% 20 0% 2010 2020 2030 2040 2050 GDP Primary energy consumption 0 2010 2020 2030 2040 2050 GDP/Capita Population Coal Oil Gas Biomass Renewables (excl. biomass) Nuclear CO2 emissions CO2 emissions/Capita Source: CEEW/IIASA
Compliance with current legislations will be essential for stabilizing pollution levels as the economy grows Computed ambient levels of PM2.5 2030 with current legislations 2015 Source: IIASA/GAINS Current emission controls are effective, but their impacts are compensated by rapid economic growth. By 2030, effective implementation and enforcement of the 2018 legislation could allow a three-fold increase in GDP without further deteriorating air quality.
Policies and measures are available that could bring air quality more in compliance with the NAAQS -Advanced Emission Control Technology Scenario Computed ambient levels of PM2.5 2030 with advanced controls 2030 with current legislations 2015 Source: IIASA/GAINS Advanced technical emission controls can deliver additional air quality improvements, but will not be sufficient to achieve the NAAQS everywhere NAAQS-compliant air quality to 60% of the Indian population
Policies and measures are available that could bring air quality more in compliance with the NAAQS -Sustainable Development Scenario Computed ambient levels of PM2.5 2030 with current legislations 2030 with development measures 2015 Source: IIASA/GAINS A package of development measures that are usually taken for other policy priorities can deliver significant co-benefits on air quality. NAAQS-compliant air quality to about 85% of the Indian population.
Air pollutant emission control costs 250 1.8% Air pollution emission control costs accounted for about 0.7% of the GDP in 2015. This share will increase to 1.4-1.7% of GDP in 2030. More than 80% of total costs emerged for mobile sources. 1.6% 200 1.4% Billion Euro/year 1.2% 150 1.0% % of GDP 0.8% 100 0.6% 0.4% 50 In 2050, with an almost 10-fold increase in GDP, air pollution controls will consume 1.1-1.5% of the GDP. 0.2% 0 0.0% 2015 measures 2015 measures 2015 2018 legislation Development 2018 legislation Development technology technology Advanced Advanced measures measures 2030 2050 Power sector Industry Residential Mobile sources Others % of GDP Source: IIASA/GAINS
Sustainable development measures can deliver a wide range of benefits In the sustainable development scenario, India s CO2 emissions would be about 60% lower in 2050 than in the baseline case. 350% 300% relative to 2015 emissions 250% 200% Even without dedicated measures focused on methane, CH4 emissions would be 40% lower in 2050 compared to the baseline case. 150% 100% 50% Black carbon emissions would decline by 80% in the development scenario in 2050 compared to 2015. 0% 201520302050 201520302050 201520302050 201520302050 CO CH All GHGs BC 2018 legislation Advanced technology Development measures Source: IIASA/GAINS
Priority measures Access to clean fuels and technologies for cooking (e.g., promotion of LPG/electric stoves) Effective implementation of current policy measures (e.g., FGD in power plants, BS-VI from 2020) Improved waste management and agricultural production practices Substituting coal with natural gas and renewables (solar/wind) in power generation and industry Improvements in energy efficiency (power, industry, transport and residential/commercial) Advanced emission controls (e.g., HED and ESP Stage-II for PM and SCR for NOx control in power plants) Enhanced public transport (e.g., metro) and increased incentives for greater adoption of electric vehicles Emission control on non-industrial sources (e.g., road dust) Coordination of urban, rural and inter-State responses
GAINS India: A productive CEEW-IIASA cooperation Markus Amann Jens Borken-Kleefeld Gregor Kiesewetter Adriana Gomez-Sanabria Zbigniew Klimont Pallav Purohit Peter Rafaj Robert Sander Wolfgang Sch pp Vaibhav Chaturvedi Hem H. Dholakia Poonam Nagar Koti
The GAINS-South Asia tool is available online to explore cost-effective strategies that maximize multiple benefits Access on the Internet: http://gains.iiasa.ac.at Thank you! purohit@iiasa.ac.at

 concentration in Indian")