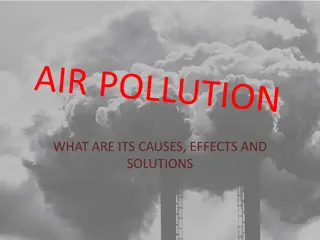
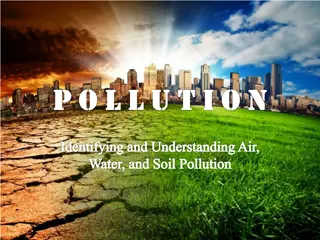
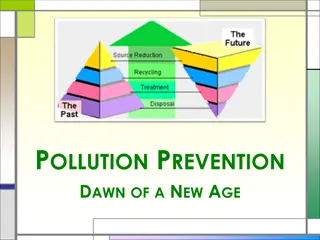
Historical Overview of Air Pollution: From London Smog to Modern Sources

Explore the history of catastrophic air pollution events dating back to 1911 in London, highlighting the impacts on public health. Learn about the major classes of air pollutants, their sources, and effects, along with key test questions related to air quality and pollution control measures. Delve into the role of coal-burning power plants as the largest single source of air pollution in the USA. Discover the differences between primary and secondary pollutants, discuss the Clean Air Act's influence on air quality changes, and understand the distinctions between industrial and photochemical smog.

Download Presentation

Please find below an Image/Link to download the presentation.
The content on the website is provided AS IS for your information and personal use only. It may not be sold, licensed, or shared on other websites without obtaining consent from the author. Download presentation by click this link. If you encounter any issues during the download, it is possible that the publisher has removed the file from their server.
E N D
Presentation Transcript
Potential Test Questions: 1. List six of the major classes of air pollutants and describe their sources and effects. 2. Relate the adverse health effects of four specific air pollutants and explain why children are particularly susceptible to air pollution. 3. Explain the differences between primary and secondary air pollutants.
Potential Test Questions: 4. Discuss the problem of the global distillation of pollutants. 5. Summarize the influential changes that have occurred in air quality due to the Clean Air Act. 6. Discuss the differences between industrial and photochemical smog.
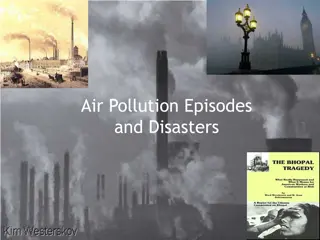
Examples of Catastrophic Air Pollution 1911 in London - 1150 died from the effects of coal smoke. Author of the report coined the word smog for the mix of smoke and fog that hung over London. 1952 in London - 4000 died from smog. 1948 in Donora, Penn. Town of 14,000 people - 20 died and 6000 were ill from smog from the community's steel mill, zinc smelter, and sulfuric acid plant. 1963 in New York City - 300 people died from air pollution.
London Smog 1952
London Smog 1952 In 13th century London - laws against burning outside because London was already heavily polluted since the middle ages
London Smog 1952
London Smog 1952
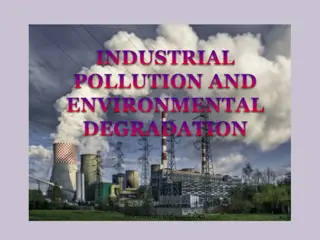
Sources of Air Pollution According to the 1997 EPA report on air quality: Coal-Burning Power Plants are the Single Largest Source of Air Pollution! In terms of volume and variety of contaminants emitted, no other single pollution source comes close. Nationally, annual power plant emissions are responsible for 36% of carbon dioxide pollution, 64% of sulfur dioxide pollution, 26% of nitrogen oxide pollution, and 34% of mercury pollution in the USA.
March 23, 2003
Earth Smog May 7, 2002
Los Angeles
An active adult inhales 10,000 to 20,000 liters of air each day, or 7 to 14 liters every minute.
Effects of Air Pollution on Human Health Contrary to popular belief, death as a result of a smog siege is often not a result of air pollutant poisoning, but rather, a result of increasing susceptibility to diseases. By and large, children, asthmatics, people with chronic respiratory or pulmonary and heart disease, and the elderly are the most susceptible to air pollutants.
Effects of Air Pollution on Human Health Because the lungs of children are not yet fully developed and because children inhale more air per unit of body weight than adults, they are prone to greater health effects as well as long-term damage to the lungs. Similarly, because asthmatics and those suffering from chronic diseases are already in a weakened state, smog adds stress to their bodies. For the elderly, smog increases their susceptibility to viral and bacterial attacks, as both lung and immune system functions decrease with age.
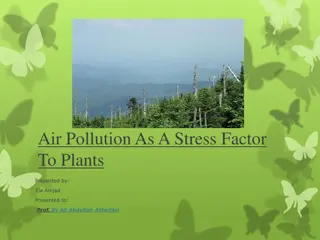
Effects of Air Pollution on Plants Air pollution commonly leads to oxidation damage of both crop plants and wild species.
Effects of Air Pollution on Plants Air pollution weakens plants by damaging their leaves, limiting the nutrients available to them, or exposing them to toxic substances slowly released from the soil. Quite often, injury or death of plants is a result of these effects of acid rain in combination with one or more additional threats.
Effects of Pollution on Buildings For limestone, the acidic water reacts with the calcium to form calcium sulfate: CaCO3 + H2SO4 CaSO4 + 2H+ + CO32- The calcium sulfate is soluble so it is easily washed away during the next rain storm. Statue carved in 1702 photographed in 1908 (left) and 1969 (right).
Costs of Pollution Health: $36 billion in sickness annually - health care and lost work. Agriculture: up to 10% of nation's crops lost to all forms of pollution. Materials: corrosion - $5.5 billion annually.
Types of Smog Industrial smog = the gray air in industrial cities in cold winter areas, caused from burning fossil fuel. Industrial smog is in the forms of dust, smoke, soot, ashes, asbestos, oil, lead, heavy metals, and sulfur oxides. In 1952, industrial smog held in place by a thermal inversion caused the 4,000 deaths in London.
Types of Smog Photochemical smog = brown and smelly, found in large cities in warm climates. Most are the result of gases from auto exhaust. This is the type of smog that hangs over Los Angeles or Houston and causes air quality warnings many days each year.
Types of Air Pollution Primary air pollutants: harmful chemicals that enter directly into the atmosphere. Secondary air pollutants: harmful chemicals that form from other substances in the atmosphere.
Indiana Compared to the Nation: Top 10% for SOX Top 20% for NOX Top 30% for CO and for VOCs (volatile organic compounds) Vandenberg county is 7th in the state of Indiana for VOCs http://lungaction.org/reports/SOTA03_stateozone.html?geo_area_id=18 http://lungaction.org/reports/SOTA03_staterisk.html?geo_area_id=18