Understanding Indoor Air Pollution: Sources, Impacts, and Control Measures
This study explores the sources and influencing factors of indoor air pollution, highlighting the importance of studying indoor air quality due to its critical impact on human health. It discusses the various pollutant categories from different sources such as outdoor elements, indoor sources, furniture, cooking, smoking, paints, and household products. Additionally, it covers the correlation between indoor and outdoor particle concentrations and factors affecting pollutant emission and transportation. Control methods and the significant role of indoor air quality in affecting people's health are also emphasized.

Download Presentation

Please find below an Image/Link to download the presentation.
The content on the website is provided AS IS for your information and personal use only. It may not be sold, licensed, or shared on other websites without obtaining consent from the author. Download presentation by click this link. If you encounter any issues during the download, it is possible that the publisher has removed the file from their server.
E N D
Presentation Transcript
Source and influencing factors of indoor air pollution Bingqing Zhang 04/14/2020
Outline Reasons for study indoor air pollution Pollution category by different sources Factors affect pollutant emission and transportation Controlling method
Why we study indoor air quality? People spend 90% of their time indoors Indoor air quality has critical effect on people s health due to long time exposure. Immediate effect: show up shortly after a single exposure or repeated exposure to a pollutant, including irritation of eyes, nose and throat, headache, dizziness and Long term effect: show up years after exposure or show up only after a long or repeated periods of exposure, such as respiratory disease, hear disease and cancer.
Pollutant category by different sources Outdoor source; Indoor source; Furniture and building material Cooking Smoking Oil paints and adhesive Household products (Huang et al., 2019)
Outdoor source Outdoor particle concentrations are a major contributor to indoor concentrations, outdoor source causing indoor pollution include automobiles, industry and combustion process; mechanical ventilation Three particle get in pathways : natural ventilation infiltration (C. Chen & Zhao, 2011)
Studies has shown that indoor particle concentration are related to outdoor concentration Correlation of indoor and outdoor PM2.5 concentration in four seasons (Bai, He, Li, & Chen, 2020)
Studies has shown that indoor particle concentration are related to outdoor concentration Contribution factor Contribution rate Cin, indoor concentration; Cout, outdoor concentration; Cig, mass concentration produced by indoor source; Qin, emission rate of indoor PM , permeability factor of outdoor to indoor; Finf, effective penetration factor; , air exchange rate; k, settling rate; Penetration factor Contribution value( g/m3) Contribution rate(%) Season AVG SD AVG SD AVG SD Spring 0.172 0 7.302 4.958 48.134 52.963 Summer 0.501 0 3.606 0.835 65.631 16.459 Autumn 0.168 0 11.217 8.963 31.034 24.149 Winter 0.135 0 14.289 12.879 34.509 25.789
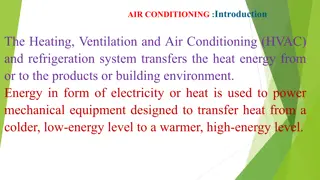
Indoor source Furniture and building material Building materials are primary source of indoor air pollutant, such as wood products, coatings and floorings. The pollutants mainly include HCHO, toluene and benzene. (L. Huang et al., 2018) Flooring materials: residences with solid wood flooring had lower concentrations of alkanes((C8, C10, C14 and C15), terpenes (d-limonene and -pinene) and alkyl benzenes (toluene, ethylbenzene, trimethylbenzene, xylenes, ethyltoluenes, tetramethylbenzene) than those with composite wood flooring Sofa materials: residences with leather sofa has significant higher concentration of -pinene, -pinene and than those residences with fabric sofa other built environmental conditions, including building age, proximate traffic condition, time interval since last renovation, times of cooking during sampling period, smoking activities during sampling period, frequency of floor cleaning and use of clothes detergent, did not significantly influent the indoor VOC concentrations.
Indoor source CH2O concentration (ppm) 0.140 0.120 0.100 0.080 Smoking 0.060 0.040 0.020 0.000 Bedrooms 1400 VOCs concentration (ppbv ) 1200 1000 800 600 400 200 (Canha, Lage, Coutinho, Alves, & Almeida, 2019) 0 10 Bedrooms CO concentration (ppm) 9 LV 8 4 3 2 1 0 Non-smoker Smoker
Indoor source Cooking (Cheng et al., 2016) (Zhang, Liu, Jia, Wang, & Han, 2019)
Indoor source Other sources (Lin, 2019) Incense, used in religious ceremonies, residence and some public places including stores and temples. Candles, made of paraffin or beeswax containing heavt straight-chain hydrocarbons. Mosquito Coil, used to prevent mosquito bite
Influencing factors RH Humidity can effect pollutant emission parameter: initial concentration, diffusion coefficient and partition coefficient HCHO measurement of a medium- density fiber board in a dynamic small- scale environment at different RH (Liang, Lv, & Yang, 2016) Relative humidity (%) Absolute humidity (g/kgair) 4.0 0.5 Ventilation rate (h^-1) Dimensions (mm*mm*mm) C0 Dm (m2/s) Temperature K (mg/m^3) 25.5 0.5 20 5 1 0.05 245 140 12 1.75 106 3.40 10 14 6340 25.5 0.5 30 5 6.1 0.5 1 0.05 245 140 12 2.00 106 3.36 10 14 5514 25.5 0.5 50 5 10.4 0.5 1 0.05 245 140 12 3.80 106 3.50 10 14 5340 25.5 0.5 80 5 16.7 0.5 1 0.05 245 140 12 5.20 106 3.14 10 14 6218
Influencing factors combined effect on temperature and RH (C. Zhou et al., 2017)
Influencing factors combined effect on temperature and RH Henry's Law Constant (Pa m3/m ol at 25 C) 0.0331 Water Solubility (g/m3 or mg/L at 25 C) Compound s AM Molecular Weight Melting Point ( C) Boiling Point ( C) Temperature effect Humidity effect Polarity (mg/m3) Formaldeh yde Butyl acetate Styrene Benzene Toluene Xylenes Ethylbenze ne n- Undecane TVOC 0.142 30.026 92.0 19.1 1220000 high +++ +++ 0.184 116.158 78 126.1 4955 medium 33.44 + 0.067 0.008 0.179 0.281 0.152 104.15 78.112 92.139 106.165 106.165 30.65 145 80.09 110.63 138.37 136.19 220 55 530 134 168 low low low low low 233 557 680 730 887 + + ++ +++ ++ + ++ ++ ++ 5.49 94.95 13.25 94.96 0.007 156.309 25.5 195.9 0.0044 low 185000 +++ ++ 0.882 +++ +++ (C. Zhou et al., 2017)
Influencing factors combined effect on temperature and RH The concentration of indoor TVOC and indoor formaldehyde increased dramatically under two conditions when(temperature>30 , RH>60%) (C. Zhou et al., 2017)
Method for indoor air pollutant controlling 1. use air purification device. Three main mechanism, adsorption, photocatalytic oxidation, catalytic oxidation. 2. ventilation. This method is limited when outdoor air quality is poor. 3. reduction of pollutant source, select environmental friendly raw material and produce building material with low VOC emission 4. suppression and elimination of pollutant in building material
Reference Klepeis, N. E., Nelson, W. C., Ott, W. R., Robinson, J. P., Tsang, A. M., Switzer, P., . . . Engelmann, W. H. (2001). The National Human Activity Pattern Survey (NHAPS): a resource for assessing exposure to environmental pollutants. Journal of Exposure Science & Environmental Epidemiology, 11(3), 231-252. doi:10.1038/sj.jea.7500165 Schweizer, C., Edwards, R. D., Bayer-Oglesby, L., Gauderman, W. J., Ilacqua, V., Juhani Jantunen, M., . . . K nzli, N. (2007). Indoor time microenvironment activity patterns in seven regions of Europe. Journal of Exposure Science & Environmental Epidemiology, 17(2), 170-181. doi:10.1038/sj.jes.7500490 Huang, Y., Su, T., Wang, L., Wang, N., Xue, Y., Dai, W., . . . Ho, S. S. H. (2019). Evaluation and characterization of volatile air toxics indoors in a heavy polluted city of northwestern China in wintertime. Science of The Total Environment, 662, 470-480. doi:https://doi.org/10.1016/j.scitotenv.2019.01.250 Chen, C., & Zhao, B. (2011). Review of relationship between indoor and outdoor particles: I/O ratio, infiltration factor and penetration factor. Atmospheric Environment, 45(2), 275-288. doi:https://doi.org/10.1016/j.atmosenv.2010.09.048 Bai, L., He, Z., Li, C., & Chen, Z. (2020). Investigation of yearly indoor/outdoor PM2.5 levels in the perspectives of health impacts and air pollution control: Case study in Changchun, in the northeast of China. Sustainable Cities and Society, 53, 101871. doi:https://doi.org/10.1016/j.scs.2019.101871 Huang, L., Qian, H., Deng, S., Guo, J., Li, Y., Zhao, W., & Yue, Y. (2018). Urban residential indoor volatile organic compounds in summer, Beijing: Profile, concentration and source characterization. Atmospheric Environment, 188, 1-11. doi:https://doi.org/10.1016/j.atmosenv.2018.06.009 Canha, N., Lage, J., Coutinho, J. T., Alves, C., & Almeida, S. M. (2019). Comparison of indoor air quality during sleep in smokers and non-smokers bedrooms: A preliminary study. Environmental Pollution, 249, 248-256. doi:https://doi.org/10.1016/j.envpol.2019.03.021 Cheng, S., Wang, G., Lang, J., Wen, W., Wang, X., & Yao, S. (2016). Characterization of volatile organic compounds from different cooking emissions. Atmospheric Environment, 145, 299-307. doi:https://doi.org/10.1016/j.atmosenv.2016.09.037 Zhang, D.-C., Liu, J.-J., Jia, L.-Z., Wang, P., & Han, X. (2019). Speciation of VOCs in the cooking fumes from five edible oils and their corresponding health risk assessments. Atmospheric Environment, 211, 6-17. doi:https://doi.org/10.1016/j.atmosenv.2019.04.043 Lin, T. S. (2019). Indoor Air Pollution: Unusual Sources . In J. Nriagu (Ed.), Encyclopedia of Environmental Health (Second Edition) (pp. 636-642). Oxford: Elsevier. Liang, W., Lv, M., & Yang, X. (2016). The effect of humidity on formaldehyde emission parameters of a medium-density fiberboard: Experimental observations and correlations. Building and Environment, 101, 110-115. doi:https://doi.org/10.1016/j.buildenv.2016.03.008 Zhou, C., Zhan, Y., Chen, S., Xia, M., Ronda, C., Sun, M., . . . Shen, X. (2017). Combined effects of temperature and humidity on indoor VOCs pollution: Intercity comparison. Building and Environment, 121, 26-34. doi:https://doi.org/10.1016/j.buildenv.2017.04.013 Zhou, X., Liu, Y., Song, C., Wang, X., Wang, F., & Liu, J. (2019). Modelling and testing of VOC source suppression effect of building materials modified with adsorbents. Building and Environment, 154, 122-131. doi:https://doi.org/10.1016/j.buildenv.2019.03.003