Long-Term Air Pollution Exposure and Risk of Death
This study aimed to assess the risk of mortality associated with long-term exposure to low levels of air pollution in areas beyond well-monitored urban regions. Using Medicare beneficiary data and advanced modeling techniques, the research focused on estimating the impact of PM2.5 and ozone concentrations below current regulatory standards on overall mortality risk. The findings highlighted the need for broader research inclusion criteria to better understand the health effects of air pollution in diverse populations and geographic locations.
Download Presentation

Please find below an Image/Link to download the presentation.
The content on the website is provided AS IS for your information and personal use only. It may not be sold, licensed, or shared on other websites without obtaining consent from the author. Download presentation by click this link. If you encounter any issues during the download, it is possible that the publisher has removed the file from their server.
E N D
Presentation Transcript
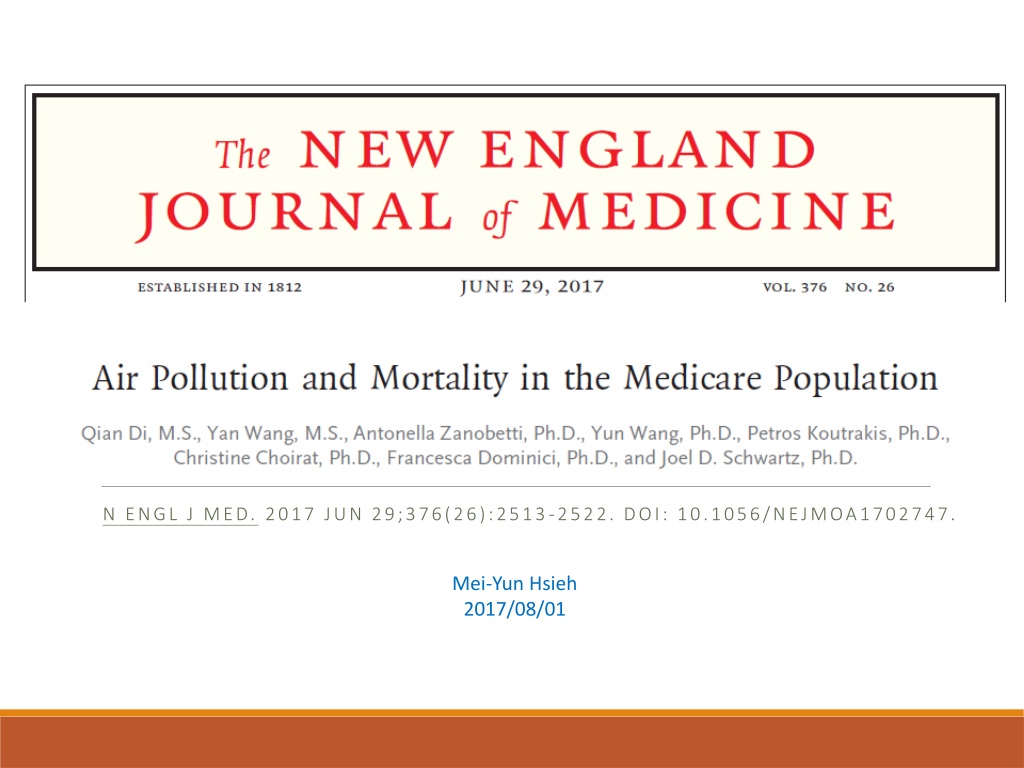
N ENGL J MED. 2017 JUN 29;376(26):2513-2522. DOI: 10.1056/NEJMOA1702747. Mei-Yun Hsieh 2017/08/01
Introduction Introduction Most of studies have included populations whose socioeconomic status is higher than the national average and who reside in well- monitored urban areas. These studies provide limited information on the health effects of long-term exposure to low levels of air pollution in smaller cities and rural areas or among minorities or persons with low socioeconomic status. Aim : To estimate the risk of death from any cause associated with long-term exposure (yearly average) to PM2.5 concentrations lower than the current annual National Ambient Air Quality Standard (NAAQS) of 12 g per cubic meter and to ozone concentrations below 50 parts per billion (ppb). 2
Methods Methods Mortality Data We obtained the Medicare beneficiary denominator file from the Centers for Medicare and Medicaid Services. We constructed an open cohort consisting of all beneficiaries in this age group in the continental United States from 2000 through 2012. We extracted the date of death, age at year of Medicare entry, year of entry, sex, race, ZIP Code of residence, and Medicaid eligibility. 3
Methods Methods Assessment of Exposure to Air Pollution We used an artificial neural network that incorporated satellite-based measurements, simulation outputs from a chemical transport model, land-use terms, meteorological data, and other data to predict daily concentrations of PM2.5 and ozone at unmonitored locations. We fit the neural network with monitoring data from the Environmental Protection Agency (EPA) Air Quality System (AQS) (in which there are 1928 monitoring stations for PM2.5 and 1877 monitoring stations for ozone). 4
Methods Methods We then predicted daily PM2.5 and ozone concentrations for nationwide grids that were 1 km by 1 km. Cross-validation indicated that predictions were good across the entire study area. The coefficients of determination (R2) for PM2.5 and ozone were 0.83 and 0.80, respectively; 5
Methods Methods For each calendar year during which a person was at risk of death, we assigned to that person a value for the annual average PM2.5 concentration, a value for average ozone level during the warm season (April 1 through September 30), and values for annual average temperature and humidity according to the ZIP Code of the person s residence. Sensitivity analysis we also obtained data on PM2.5 and ozone concentrations from the EPA AQS and matched that data with each person in our study on the basis of the nearest monitoring site within a distance of 50 km. 6
Methods Methods Statistical Analysis We fit a two-pollutant Cox proportional-hazards model with a generalized estimating equation to account for the correlation between ZIP Codes. The risk of death from any cause associated with long-term exposure to PM2.5 was always adjusted for long-term exposure to ozone. We conducted this same statistical analysis but restricted it to person- years with PM2.5 exposures lower than 12 g per cubic meter and ozone exposures lower than 50 ppb (low-exposure analysis). 7
Methods Methods Data on some important individual-level covariates were not available for the Medicare cohort, including data on smoking status, body mass index (BMI), and income. We obtained data from the Medicare Current Beneficiary Survey (MCBS). We used R software, version 3.3.2 and SAS software, version 9.4. 8
Results Results 9
Results Results 10
Each increase of 10 g per cubic meter in annual exposure to PM2.5 and each increase of 10 ppb in warm-season exposure to ozone was associated with an increase in all-cause mortality of 7.3% and 1.1%. 12
Subgroup analyses Subgroup analyses 13
Conclusion Conclusion This study involving an open cohort of all persons receiving Medicare, including those from small cities and rural areas, showed that long-term exposures to PM2.5 and ozone were associated with an increased risk of death, even at levels below the current annual NAAQS for PM2.5. The study showed that black men and persons eligible to receive Medicaid had a much higher risk of death associated with exposure to air pollution than other subgroups. 15
Discussion Discussion Strength Assessment of exposure with high spatial and temporal resolution. The current ozone standard for daily exposure is 70 ppb; there is no annual or seasonal standard. Our results strengthen the argument for establishing seasonal or annual standards. 16
