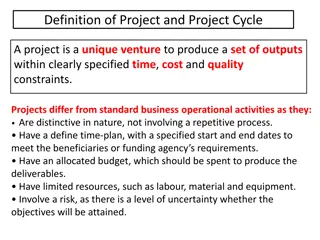
Insights into Project Management Practices
Observations in top and middle-level management reveal a tendency to place blame internally rather than externally. Questions arise regarding the handling of uncertainty in project estimation and the focus of companies on saving money over making money. The challenges of project management include struggling with time, cost, and scope, as well as the need for clear signals for corrective actions. The normal practices in planning and execution phases are outlined, emphasizing the importance of task allocation, time contingency, and addressing delays promptly.

Download Presentation

Please find below an Image/Link to download the presentation.
The content on the website is provided AS IS for your information and personal use only. It may not be sold, licensed, or shared on other websites without obtaining consent from the author. Download presentation by click this link. If you encounter any issues during the download, it is possible that the publisher has removed the file from their server.
E N D
Presentation Transcript
LECTURE 11/12 CONTROL SCHEDULE
General Observations In top and middle level management s opinion, It's always somebody else's fault. Blame it on someone. The lower the level of the person, the more the finger points internally, rather than externally. People complain about lack of sufficient supervision of the vendors, but at the same time they also complain that they are so overloaded they barely have time to deal with fires.
Some Questions? Why isn't the uncertainty properly factored into the original estimation? Why are Companies so immersed in the mentality of saving money that they forget that the project is not to save money but to make money?
What is our normal experience from today's way of Project Management ? Reliable on time in full to budget delivery performance ? Or A continuous struggle with time, cost and scope ? A stable plan Repeated rescheduling ? Simple, objective measures of Project progress ? Or Clarity at the start and end, thick fog in between ? Simple, objective measures of Project health status ? Subjective assessments compounded by human factors ? Clear signals for when corrective action is - and is not - necessary ? Or Intervening too much too early, and too little too late ? Direction for ongoing improvement efforts ? Or "We'll improve our methods when things get better" Or Or
'Normal' Practice in the planning phase We identify the tasks in the Project and specify the resources needed for each one We allocate to each task sufficient time that we are confident will allow it to be completed with those resources. That is, the time the task should take on average, plus some contingency to give us the confidence we seek We apply task dependencies, and work out the longest path of tasks in the Project The time along this path is the time-line of the Project
Normal practice in the execution phase As long as every task completes on time (within its contingency), its successors will be started on time As soon as any task finishes late (outside its contingency), its successors will start late, and this normally means they will finish late In order to rescue a Project which shows any lateness, we have to squeeze the remaining tasks in the Project Typically we have to compromise on time, cost or scope and reschedule
How long should we allow in the plan for a task ? Some staff work more quickly than others Sometimes staff are distracted or interrupted Sometimes necessary resources are delayed Some staff are risk-averse in their commitments Some organisations reinforce risk-aversion Strikes etc
How long do we allow in the plan for a task ? The average time the task ought to take an average performer who focuses on it PLUS The time we expect to be spent on distractions PLUS A contingency time to take account of: The spread between average and low performers Our uncertainty in the average time Our uncertainty in the time for distractions How risk-averse we are or have to be
Don't overreact to buffer erosion We expect our buffer to be used up over the course of the Project Our date is not threatened if the buffer is used up in proportion to progress If we have 2/3 of the completion buffer left and only 1/3 of the Project to do we are doing fine Our date is threatened if the buffer is used up disproportionately
Measures Summary We have simple, objective measure of Project progress We have a simple, objective measure of Project health status We have a simple rule for triggering - and not triggering - corrective action We can redefine the Project progress meeting as the Buffer Management Meeting
Buffer Management Meeting Attendees: Project Manager, Project Sponsor / Owner, Task Managers, Resource Managers Agenda: 1. 2. 3. 4. Reminder of what tasks are on the Critical Chain. Review Project status ( % Critical Chain outstanding). Review Completion buffer status (Red, Amber, Green). If necessary, initiate corrective actions. Review Feeding buffers status (Red, Amber, Green). necessary, initiate corrective actions. Review tasks in progress to ensure earliest completion in full. Review tasks not started to ensure earliest start where appropriate. If 5. 6.
Using Buffer Management to drive ongoing improvement Buffer Management measures are fact-based and objective Buffer Management meetings highlight buffer erosion / Project delays Preventing the causes of delay will speed up your Projects Your process of ongoing improvement is simply to eliminate the causes of delay by following up on the issues highlighted in Buffer Management meetings As your Projects run faster and more reliably, continue to eliminate more and more causes of delay
Control Schedule Schedule control is concerned with: Determining the current status of the project schedule, Influencing the factors that create schedule changes, Determining that the project schedule has changed.
Monitoring & Controlling Performance Reviews and Performance Reviews measure, compare, and analyze schedule performance. An important aspect is to decide whether the variations effect the critical path and thus schedule baseline and need any corrective action Time Techniques Tools & Earned Value Management (EVM) Schedule Variance (SV) Schedule Performance Index (SPI) Compare the amount of buffer remaining to the amount of buffer needed to protect the delivery date. Critical Chain Method
Monitoring & Controlling and Time Techniques Tools &
Monitoring & Controlling and Time Techniques Tools &
Monitoring & Controlling 1. Work Performance Measurements and Time The calculated schedule variance (SV) and schedule performance index (SPI) values for WBS components, in particular the work packages and control accounts, are documented and communicated to stakeholders. Outputs
Monitoring & Controlling 2. Organizational Process Assets Updates (OPA+) and Time Lessons Learned Causes of Variances Corrective Actions with Reasons Updates Outputs 1. Processes and Procedures .2 Corporate Knowledge Base Formal and Informal Plans lessons learned Policies , guidelines and Templates historical information Learning from previous projects Change Control Procedures completed schedules, risk data, and earned value data Configuration Management
Monitoring & Controlling 3. Change Requests and Change requests are issued during Execution which may expand, adjust, or reduce project scope to modify project policies or procedures, to modify project cost or budget, or to revise the project schedule. Other change requests cover needed preventive or corrective actions to forestall negative impact later in the project. Time Corrective actions. Preventive actions. Defects. Updates. Direct Indirect External Internal Optional Legal/ Contractual
Monitoring & Controlling 4. Project Management Plan Updates and Time Elements of the project management plan that may be updated include but are not limited to: Schedule baseline Schedule management plan Scope baseline Cost baseline
Monitoring & Controlling 5. Project Document Updates and Time Project documents that may be updated include but are not limited to: Documents Schedule Data Project Schedule
Project Time Management Important formulae Total Float (also called Slack, Float, or Project Float) is the total amount of time an activity can be delayed without delaying the project finish date. Total float=LF-LS Total Float-EF-ES Free Float/Slack is the amount of time an activity can be delayed without delaying its successor (following activity).
Project Time Management Important formulae Free float=ES of Following activity-ES of present activity-Duration of present Activity LS ES: Calculates slack with forward pass LF EF: Calculates slack with backwards pass EF=ES+duration-1 ES=EF+ 1 LS=Lf-duration+1 LF=LF of predecessor-1
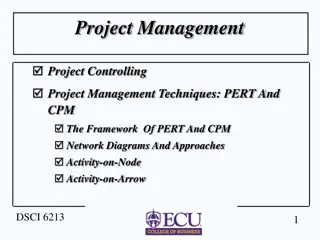
Project Time Management Important formulae Lag Time: Inserted wait time between activities Lead Time: Overlapping activities, also called paralleling or fast tracking. Lead In; Lag Out Precedence Diagramming Method (PDM) is also called Activity on Node (AON): Activities are in boxes Most commonly used today Has 4 relationships: F-S, S-S, F-F, S-F No dummies (zero duration dependencies) allowed
Project Time Management Important formulae Can analyze using either Three-Point Estimates or CPM Arrow Diagramming Method (ADM) Also called Activity on Arrow (AOA) Only 1 relationship: F-S Can have dummies Can analyze using either Three-Point Estimates or CPM Graphical Evaluation and Review Technique (GERT) Allows loops and repetitive activities .
Project Time Management Important formulae PERT = PROGRAM Evaluation and Review Technique Holds schedule and lets cost float 3 estimates for each task: Optimistic, Pessimistic, and Most Likely Mean Estimate = (O + 4*ML + P)/6 Standard Deviation (s) = (P O)/6 Variance = s2 , or [(P O)/6]2 Order of Magnitude:-25% to +75% Budget Estimate:-10% to +25% Definitive Estimate:-5% to +10%
SCHEDULE VARIANCE Formula for Schedule Variance (SV) Schedule Variance can be calculated by subtracting planned value from earned value. Schedule Variance = Earned Value Planned Value SV = EV PV From the above formula, we can conclude that: If Schedule Variance is positive, this means you are ahead of schedule. If Schedule Variance is negative, this means you are behind schedule. If Schedule Variance is zero, this means you are on schedule. When the project is completed Schedule Variance becomes zero, because at the end of the project all Planned Value has been earned.
SCHEDULE VARIANCE You have a project to be completed in 12 months and the cost of the project is 100,000 USD. Six months have passed and 60,000 USD has been spent, but on closer review you find that only 40% of the work has been completed so far. Find the project s Schedule Variance (SV), and deduce whether you are ahead of schedule or behind schedule.?
Project Time Management SCHEDULE VARIANCE You have a project to be completed in 12 months and the cost of the project is 100,000 USD. Six months have passed and 60,000 USD has been spent, but on closer review you find that only 40% of the work has been completed so far. Find the project s Schedule Variance (SV), and deduce whether you are ahead of schedule or behind schedule. Given in the question: Actual Cost (AC) = 60,000 USD Planned Value (PV) = 50% of 100,000 = 50,000 USD Earned Value (EV) = 40% of 100,000 = 40,000 USD Now, Schedule Variance = Earned Value Planned Value = 40,000 50,000 = 10,000 USD Hence, the project s Schedule Variance is -10,000 USD, and since it is negative, you are behind schedule.