Service Planning and Network Design: Enhancing Transit Quality
Explore the essentials of service planning and network design developed by experts. Dive into the basics of quality transit service, service availability, comfort, convenience, and more to enhance the overall efficiency and effectiveness of transit systems.

Download Presentation

Please find below an Image/Link to download the presentation.
The content on the website is provided AS IS for your information and personal use only. It may not be sold, licensed, or shared on other websites without obtaining consent from the author. Download presentation by click this link. If you encounter any issues during the download, it is possible that the publisher has removed the file from their server.
E N D
Presentation Transcript
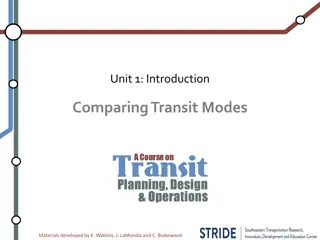
Unit 4: Service Planning & Network Design Service Planning & Standards Materials developed by K. Watkins, J. LaMondia and C. Brakewood
Outline Quality of service basics Service availability Comfort and convenience Defining quality transit service Materials developed by K. Watkins, J. LaMondia and C. Brakewood
QUALITY OF SERVICE BASICS Materials developed by K. Watkins, J. LaMondia and C. Brakewood
Transit service Transit serves two populations Choice riders Transit dependents riders Materials developed by K. Watkins, J. LaMondia and C. Brakewood
Performance Points of View Materials developed by K. Watkins, J. LaMondia and C. Brakewood
Quality of Service Availability Comfort and Convenience Passenger Load Reliability Travel Time Frequency Service Span Access Materials developed by K. Watkins, J. LaMondia and C. Brakewood
SERVICE AVAILABILITY Materials developed by K. Watkins, J. LaMondia and C. Brakewood
Service Availability Materials developed by K. Watkins, J. LaMondia and C. Brakewood
Service Frequency Frequency is the number of transit vehicles in a given period of time. Headway is the measurement of time between transit vehicles. Headway = 1 Frequency Frequency generally divided into 2 categories: High Frequency Service: Headways less than 10 minutes Low Frequency Service: Headways greater than 10 minutes Materials developed by K. Watkins, J. LaMondia and C. Brakewood
Frequency & Wait Time Frequency is important because it determines waiting times. Wait time for high frequency transit is, on average, half of the headway. Wait Time = Headway 2 (That is if it s reliable more later) Materials developed by K. Watkins, J. LaMondia and C. Brakewood
Service Frequency Mean Headway Passenger Perspective No schedule needed Bus bunching likely Operator Perspective High-density (high-ridership) Exclusive right-of-way highly desirable Bunching can occur in mixed traffic Possibly cannot add more frequency High-density or major activity center Exclusive right-of-way desirable Possible bunching Possible to increase frequency Branded as frequent service Higher-density or strong anchors Longest possible to still be BRT Typically 20- or 30-min headways Moderate-density corridors Typical commuter rail headway Longest commuter bus headway 5 min No schedule needed Bus bunching possible > 5 10 min Need schedule Max desired wait for missed bus Need schedule Adapt to schedule 11 15 min 16 30 min Materials developed by K. Watkins, J. LaMondia and C. Brakewood
Service Frequency Average Headway Passenger Perspective Non-clockface headways require check schedules Must adapt to the transit schedule Minimal service for basic travel needs Must adapt to the transit schedule Undesirable for urban transit service Operator Perspective Typically 40- or 45-min headways Low-to-moderate density 31 - 59 Maximum headway for fixed route bus Low density with subsidy Service coverage standard 60 min Should consider demand responsive > 60 min Materials developed by K. Watkins, J. LaMondia and C. Brakewood
Service Span Span is the length of time that transit service runs. Spans can be all day or can have peaks. Materials developed by K. Watkins, J. LaMondia and C. Brakewood
Hours of Service Service at least hourly Round (last trip first trip + 1 hr) Hourly-or-worse service Count the number of departures. Materials developed by K. Watkins, J. LaMondia and C. Brakewood
Service Span Hours of Service Passenger Perspective Full range of purposes Replace riskier travel (drunk driving) Operator Perspective Night or owl Added driver pay Security Route differences More than two drivers Route differences Two drivers per vehicle > 18 h Broad range of purposes Work trips with flexibility Midday trips Limited flexibility Some AM & PM choice 15 18 h 12 14 h One driver with gap or part-time help Commuter bus / rail Part-time drivers Intra-county Rotate drivers 7 11 h 4 6 h Lifeline service Passengers plan around service < 4 h Materials developed by K. Watkins, J. LaMondia and C. Brakewood
Access Is transit service provided near one s desired origins and destinations? Can one get to and from the necessary transit stops or stations? Materials developed by K. Watkins, J. LaMondia and C. Brakewood
Walk Access Route density Route miles per sq mile Geographic coverage Percentage of service area served Transit market coverage Transit-supportive (high density) area served Materials developed by K. Watkins, J. LaMondia and C. Brakewood
Actual walking distance Materials developed by K. Watkins, J. LaMondia and C. Brakewood
Impact of Street Network Materials developed by K. Watkins, J. LaMondia and C. Brakewood
Impact of Street Network Materials developed by K. Watkins, J. LaMondia and C. Brakewood
Impact of Street Network Materials developed by K. Watkins, J. LaMondia and C. Brakewood
Bike and Drive Access Bike access Up to 1.25 mi for local bus Up to 2.5 mi for rapid transit Auto access Up to 2.5 mi for park-n-ride lots Materials developed by K. Watkins, J. LaMondia and C. Brakewood
COMFORT AND CONVENIENCE Materials developed by K. Watkins, J. LaMondia and C. Brakewood
Passenger Load Materials developed by K. Watkins, J. LaMondia and C. Brakewood
Passenger Load Materials developed by K. Watkins, J. LaMondia and C. Brakewood
Space Available Materials developed by K. Watkins, J. LaMondia and C. Brakewood
Reliability Measures On-time performance Headway adherence Excess wait time Missed trips Percent of scheduled time in operation Distance between mechanical breakdowns Materials developed by K. Watkins, J. LaMondia and C. Brakewood
WHAT IS ON TIME ? Materials developed by K. Watkins, J. LaMondia and C. Brakewood
Reliability Measures On-time performance Scheduled service (headways > 10 minutes) % on-time vehicles By run, by route or for system Definition of on-time Headway adherence Standard deviation of headway deviations cvh = Mean scheduled headway Materials developed by K. Watkins, J. LaMondia and C. Brakewood
Excess Wait Time Where: tw = avg wait time (min) h = avg scheduled headway (min) cvh = coefficient of variation of headways Materials developed by K. Watkins, J. LaMondia and C. Brakewood
Long-headway Waiting Time Materials developed by K. Watkins, J. LaMondia and C. Brakewood
On-time performance Materials developed by K. Watkins, J. LaMondia and C. Brakewood
MARTA On-time (bus) Materials developed by K. Watkins, J. LaMondia and C. Brakewood
MARTA On-time (rail) Materials developed by K. Watkins, J. LaMondia and C. Brakewood
Travel Time Number of transit vehicles needed to operate route at a given headway Preferential treatments measured by travel time saved Average speed allows peer routes or peer agency comparison ridership elasticity factors Travel time rate 1 / avg speed Preferential treatments Materials developed by K. Watkins, J. LaMondia and C. Brakewood
Transit-Auto TT Ratio Materials developed by K. Watkins, J. LaMondia and C. Brakewood
Passenger Safety & Security Accident rate (accidents per distance) Passenger safety (injuries or fatalities) Percent positive drug and alcohol tests Number of traffic tickets issued to operators Number of station overruns (manually operated rail systems) Number of fires Number of crimes (crime rate) Ratio of police officers to transit vehicles Number of vehicles or stations with safety devices Materials developed by K. Watkins, J. LaMondia and C. Brakewood
Customer Service Service Center Measurements Number of call missed Response time Compliment and complaint tracking Passenger Satisfaction Rider surveys Materials developed by K. Watkins, J. LaMondia and C. Brakewood
Passenger Environment Cleanliness and appearance Customer information Equipment condition Operators or station agents Materials developed by K. Watkins, J. LaMondia and C. Brakewood
DEFINING QUALITY TRANSIT SERVICE Materials developed by K. Watkins, J. LaMondia and C. Brakewood
Quality of Service Availability Comfort and Convenience Passenger Load Reliability Travel Time Frequency Service Span Access Materials developed by K. Watkins, J. LaMondia and C. Brakewood
Elements of Good Transit Service 7 Demands of Useful Service It takes me where I want to go. It takes me when I want to go. It is a good use of my time. It is a good use of my money. It gives me freedom (to change my plans). It respects me. I can trust it. Materials developed by K. Watkins, J. LaMondia and C. Brakewood
Exercise comparing TCQSM & Walker Materials developed by K. Watkins, J. LaMondia and C. Brakewood
Elements of Good Transit Service 7 Demands of Useful Service It gives me freedom (to change my plans). It takes me where I want to go. It takes me when I want to go. It is a good use of my time. It is a good use of my money. It I can trust it. respects me. Materials developed by K. Watkins, J. LaMondia and C. Brakewood
Elements of Good Transit Service 7 Demands of Useful Service It gives me freedom (to change my plans). It takes me where I want to go. It takes me when I want to go. It is a good use of my time. It is a good use of my money. It I can trust it. respects me. Stops/ Stations Speed or Delay Frequency Span Fares Civility Reliability Simplicity /Presentation Connectivity How Transit Services Them Materials developed by K. Watkins, J. LaMondia and C. Brakewood
Elements of Good Transit Service 7 Demands of Useful Service It gives me freedom (to change my plans). It takes me where I want to go. It takes me when I want to go. It is a good use of my time. It is a good use of my money. It I can trust it. respects me. Access Stops/ Stations Speed or Delay Frequency Span Fares Civility Reliability Travel Time Passenger Load Simplicity /Presentation Connectivity How Transit Services Them Materials developed by K. Watkins, J. LaMondia and C. Brakewood
STAGES OF SERVICE PLANNING Materials developed by K. Watkins, J. LaMondia and C. Brakewood
Service Planning Steps Network design Route design and stop layout Frequency determination Timetabling Vehicle scheduling Crew scheduling Materials developed by K. Watkins, J. LaMondia and C. Brakewood
Reference The materials in this lecture were taken from: Chapter 4 and 5 of the TCRP Report 165, Transit Capacity and Quality of Service Manual, 3rdedition , 2013 TCRP Report 88, A Guidebook for Developing a Transit Performance-Measurement System . Transportation Research Board, 2003. Walker, J. (2011). Human transit: How clearer thinking about public transit can enrich our communities and our lives. Island Press. Hickman, Mark, Fundamentals of Transportation wikibook, Network Design & Frequency , http://en.wikibooks.org/wiki/Fundamentals_of_Transportation/ Network_Design_and_Frequency TCRP Report 113, Using Archived AVL-APC Data to Improve Transit Performance and Management . Transportation Research Board, 2006. Materials developed by K. Watkins, J. LaMondia and C. Brakewood


")
")