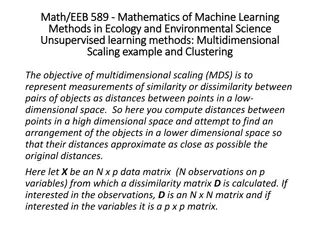
Understanding Multidimensional Scaling and Cluster Analysis

Multidimensional scaling (MDS) is a powerful technique for data reduction that helps reveal underlying relationships among observations without the need for metric data. It is particularly valuable for field researchers dealing with nonmetric measurements. MDS generates graphical representations of relationships among items, such as individuals, objects, or attitude-related questions. By using matrices of associations, MDS can visualize the closeness or distance between variables, offering valuable insights for analysis.

Download Presentation

Please find below an Image/Link to download the presentation.
The content on the website is provided AS IS for your information and personal use only. It may not be sold, licensed, or shared on other websites without obtaining consent from the author. Download presentation by click this link. If you encounter any issues during the download, it is possible that the publisher has removed the file from their server.
E N D
Presentation Transcript
Multidimensional scaling and cluster analysis Finding arrays (dimensions) and chunks
Multidimensional scaling MDS is a multivariate data-reduction technique. Like factor analysis, it is used to tease out underlying relations among a set of observations. Like factor analysis, MDS requires a matrix of measures of associations. Unlike factor analysis, MDS does not require metric data.
Metric and nonmetric data MDS is particularly useful for field researchers, since a lot of the measurements we make are nonmetric Attitudes and preferences vs. distances and weights, for example. Also, MDS produces a graphic display of the relation among any set of items, whether those items are people, or things, or questions about attitudes.
How MDS works We start with a matrix of associations, like the following. The inside box shows association among three variables. The outside box shows association among four variables.
Matrix of Association among Four Variables A B C D A X 0.5 0.8 0.3 B X 0.4 0.65 C X 0.35 D X
Variables A and C are more closely related to one another than are A and B, or B and C. You can represent this set of relations with a triangle. Matrix of Association among Four Variables A B C D A X 0.5 0.8 0.3 B X 0.4 0.65 C X 0.35 D X
In other words, we can place points A, B, and C on a plane in some position relative to each other.
The distance between A and B is longer than that between A and C (reflecting the difference between .50 and .80); and the distance between B and C is longer than that between A and C (reflecting the difference between .40 and .80). Since the numbers in this graph are similarities, the lower the correlation, the longer the distance; the higher the correlation, the shorter the distance.
With just three variables, it is easy to plot these distances in proper proportion to one another. In fact, the triangle contains precisely the same information as the inside box of the table, but in graphic form.
With four variables, there are six relations to cope with. These relations are shown in the large box of the table. When we have only two dimensions to work with, it is often impossible to achieve perfect proportionality in a graph of six relations.
One way out is to depict the six relations in three dimensions. The extra dimension would give us plenty of room to move around and we could better adjust the proportionality of the distances between the various pairs of variables.
In principle, you can represent perfectly the relations among n variables in n 1 dimensions, so that any graph of six variables can be perfectly represented in five dimensions. But even a three-dimensional graph is hard to read. What would you do with a five-dimensional graph?
Stress and MDS Most researchers specify a two-dimensional solution when they run an MDS analysis. MDS programs produce a measure how far off a graph is from one that would be perfectly proportional. Here s a set of dissimilarities that can be graphed in 2D with almost no stress.
Distances Between Nine U.S. Cities in Miles source: AnthroPac 4.0. and AnthroPac 4.0 Methods Guide, by S. P. Borgatti, 1992a, 1992b. BOS NY DC MIA CHI SEA SF LA DEN Boston 0 NY 206 0 DC 429 233 0 Miami 1504 1308 1075 0 Chicago 963 802 671 1329 0 Seattle 2976 2815 2684 3273 2013 0 SF 3095 2934 2799 3053 2142 808 0 LA 2979 2786 2631 2687 2054 1131 379 0 Denver 1949 1771 1616 2037 996 1037 1235 1059 0
A peculiar map of the U.S. All nine cities are placed in proper juxtaposition to one another, but the map looks sort of upside-down and backward. It s upside-down and inside out, but the MDS program got it just right.
You can use MDS to create outline maps of your own remembering that you can rotate any graph through some angle about any axis, and it will still have the same meaning.
Moving to nonmetric data So, a cluster of items in an MDS graph with low stress is likely to reflect some reality about the cognitive world of the people being studied. In other words, we can explore mental maps for a cultural domain.
Pile sort data for an individual proximity matrix A List of 18 Fruits for a Pile Sort 1. Apple 2. Orange 3. Papaya 4. Mango 5. Peach 6. Blueberry 7. Watermelon 8. Pineapple 9. Pear One Person s Sorting of 18 Fruits Pile #1: 2, 11, 13 Pile #2: 1, 5, 9, 14, 17, 18 Pile #3: 3, 4, 8, 15, 16 Pile #4: 6, 10 Pile #5: 7, 12 10.Strawberry 11. Lemon 12. Cantelope 13. Grapefruit 14. Plum 15. Banana 16. Avocado 17. Fig 18. Cherry Here are data from one person s pile sort of 18 fruits.
Properties of the matrix And here s what the individual proximity matrix looks like for these data. This is a similarity matrix. Note the difference with the city-by-city data: dissimilarity matrix.
Similarity Matrix from One Persons Pile-Sorting of the 18 Fruits 1 2 3 4 5 6 7 8 9 10 11 12 13 14 15 16 17 18 AP OR PA MA PE BL WA PI PE ST LE CA GR PL BA AV FI CH -- -- -- -- -- -- -- -- -- -- -- -- -- -- -- -- -- -- 1 APPLE 1 0 0 0 1 0 0 0 1 0 0 0 0 1 0 0 1 1 2 ORANGE 0 1 0 0 0 0 0 0 0 0 1 0 1 0 0 0 0 0 3 PAPAYA 0 0 1 1 0 0 0 1 0 0 0 0 0 0 1 1 0 0 4 MANGO 0 0 1 1 0 0 0 1 0 0 0 0 0 0 1 1 0 0 5 PEACH 1 0 0 0 1 0 0 0 1 0 0 0 0 1 0 0 1 1 6 BLUEBERRY 0 0 0 0 0 1 0 0 0 1 0 0 0 0 0 0 0 0 7 WATERMELON 0 0 0 0 0 0 1 0 0 0 0 1 0 0 0 0 0 0 8 PINEAPPLE 0 0 1 1 0 0 0 1 0 0 0 0 0 0 1 1 0 0 9 PEAR 1 0 0 0 1 0 0 0 1 0 0 0 0 1 0 0 1 1 10 STRAWBERRY 0 0 0 0 0 1 0 0 0 1 0 0 0 0 0 0 0 0 11 LEMON 0 1 0 0 0 0 0 0 0 0 1 0 1 0 0 0 0 0 12 CANTELOPE 0 0 0 0 0 0 1 0 0 0 0 1 0 0 0 0 0 0 13 GRAPEFRUIT 0 1 0 0 0 0 0 0 0 0 1 0 1 0 0 0 0 0 14 PLUM 1 0 0 0 1 0 0 0 1 0 0 0 0 1 0 0 1 1 15 BANANA 0 0 1 1 0 0 0 1 0 0 0 0 0 0 1 1 0 0 16 AVOCADO 0 0 1 1 0 0 0 1 0 0 0 0 0 0 1 1 0 0 17 FIG 1 0 0 0 1 0 0 0 1 0 0 0 0 1 0 0 1 1 18 CHERRY 1 0 0 0 1 0 0 0 1 0 0 0 0 1 0 0 1 1
The informant put items 2, 11, and 13 into a pile, so there are 1s where items 2 and 11 intersect, where items 2 and 13 intersect and where 11 and 13 intersect. The zeros represent no similarity of a pair of items there are, of course zeros down the diagonal. This particular matrix is also symmetric.
Visualizing relations with MDS There are no numerical operations here. The individual proximity simply displays the symmetric similarities implied by the data. Here is an MDS of these similarity data. It is a visualization of how this informant sees the similarities among those 18 fruits.
1.71 GRAPEFRUIT 1.32 LEMON ORANGE 0.94 0.55 CANTELOPE STRAWBERRY WATERMELON PLUM 0.17 APPLE PEACH FIGCHERRY BLUEBERRY PEAR -0.22 -0.60 MANGO PAPAYA PINEAPPLE BANANA -0.98 AVOCADO -1.37 -1.75 -2.14 -2.14 -1.37 -0.60 0.17 0.94 1.71
Mental maps The MDS plot is a representation of what the informant was thinking when she pile-sorted those fruits. No one claims that MDS graphs are one-for-one maps of what s happening inside people s heads.
Aggregate proximity matrices 20 pile sorts produce 20 individual matrices. Stack the matrices, look down through each cell, count up the number of 1s, and divide by n. That produces an aggregate proximity matrix. An MDS on the aggregate matrix produces a mental map for the group.
Wellers Guatemala data Susan Weller asked 20 Guatemalan women to list as many illnesses as they could think of. She put the 27 most-frequently named illnesses on cards. 24 women sorted the cards into piles.
The next graph shows an MDS of Wellers urban sample of the pile-sort data. Illness terms judged to be similar are closer together and the terms judged to be dissimilar are farther apart. Weller, S. C. 1983. New data on intracultural variability: The hot-cold concept of medicine and illness. Human Organization 42:249 57.
Interpreting an MDS graph Arrays, or dimensions Clumps, or clusters. Clumps: gastrointestinal disorders and childhood disorders. Dimensions: acute illnesses (top to bottom) and infectious vs. noninfectious illnesses (left to right).
Humans are pattern-finding animals Be careful in using factor analysis, MDS, and other dredging techniques that present you with something to explain.
Cluster analysis Start with a similarity matrix. If you factor the matrix, you find underlying variables that may encompass the variables in the original data. If you scale the matrix (MDS), you get a map that shows you graphically the relations among the items. Clustering tells you which items go together and in what order.
Does kidney pain go with the arthritis-rheumatism- allergies group of chronic illnesses or does it go with the diarrhea etc. group of intestinal infections? Or is it somehow a cognitive bridge between these groups? Cluster analysis can help here.
Things that make people uncomfortable in a car Here s an MDS of things that make people uncomfortable in a car. The data are from pile sorts, after free lists on this topic.
Multidimensional Scaling of 25 Uncomfortable Things (N=22) Items (Uncomfortable Things) (Uncomfortable Things) Sun hot on one side A B C D Too hot when you first get in Seats too hot when you first get in A - .9 .3 .4 Too hot Items B .9 - .4 .2 AC no cool fast enough Too cold when you first get in Heater not heat fast enough C .3 .4 - .8 Front passenger too hot D .4 .2 .8 - Back passenger unhappy with temperature Too cold Climate control difficult Blower not reach backseat Front passenger too cold Too humid People fight over control Air is stuffy Too much air in your face & hair Vents make your eyes dry Heater/AC too noisy Back window foggy inside Frost on inside of windshield Outside mirror foggy Foggy windshield inside Windshield too noisy Side window foggy inside
Cluster analysis lets us test our intuition about whats going on.
Multidimensional Scaling of 25 Uncomfortable Things (N=22) Items (Uncomfortable Things) (Uncomfortable Things) A B C D Sun hot on one side A - .9 .3 .4 Too hot when you first get in Seats too hot when you first get in Items B .9 - .4 .2 Too hot Air C .3 .4 - .8 AC no cool fast enough Too cold when you first get in Heater not heat fast enough D .4 .2 .8 - Front passenger too hot Back passenger unhappy with temperature Temperature Too cold Climate control difficult Blower not reach backseat Front passenger too cold Too humid People fight over control Air is stuffy Too much air in your face & hair Vents make your eyes dry Heater/AC too noisy Back window foggy inside Frost on inside of windshield Outside mirror foggy Noise Foggy windshield inside Visibility Windshield too noisy Side window foggy inside
Heres how cluster analysis works In cluster analysis, each item is its own cluster. The goal of most hierarchical clustering procedures is to agglomerate items or clusters, until you get one complete cluster or k clusters. So, to begin you first find the two clusters (items) that are closest to each other. Consider the following: 1 3 7 9 14 20 21 25 The distance between 20 and 21 is 1. The distance between 1 and 3 is 2. The distance between 21 and 25 is 4. In a numerical sense, 20 and 21 twice as similar to one another as 1 and 3 are to one another; and 1 and 3 are twice as similar to one another as 21 and 25 are to one another.
Dissimilarity Matrix for Clustering source: Hierarchical Cluster Analysis by V. J. de Ghett, 1978, Quantitative Ethology, ed. by P. W. Colgan. 1 3 7 9 14 20 21 25 1 0 3 2 0 7 6 4 0 9 8 6 2 0 14 13 11 7 5 0 20 19 17 13 11 6 0 21 20 18 14 12 7 1 0 25 24 22 18 16 11 5 4 0 Cluster 20 and cluster 21 will be the first to be joined. They will form cluster 20,21.
Having first merged the closest (most similar) two clusters, there are several ways to continue to find clusters in this matrix, based on different ways of calculating distance between clusters. Two of them are: single-link or closest-neighbor distance between clusters is the shortest distance between members of each cluster. complete-link or farthest-neighbor distance between clusters is the farthest distance between members of each cluster. Here are the two clustering solutions:
Single-link solution The two closest (most similar) neighbors are 20 and 21. They are joined at level 1. The numbers 1,3 and the numbers 7,9 are the next closest neighbors. They are joined at level 2. Once a pair is joined, it is a unit. The clusters 1,3 and 7,9 join at level 4. They are 4 units apart (the nearest neighbor to cluster 1,3 is 7, which is 4 units from 3). Distance threshold The cluster 21,25 are also four units apart. But 20,21 are already joined, so 25 joins this cluster at level 4. Merge two clusters if the minimum distance between its members is less than or equal to the distance threshold.
Complete-link solution Once again, 20,21 join at level 1 and the pairs 1,3 and 7,9 join at level 2. So far this is just like in the single-link solution. But then things change: At the next level, the neighbors of cluster 20,21 are 14 and 25. The farthest (most dissimilar) neighbor from 14 to cluster 20,21 is 21. The distance is 7 units. The farthest neighbor from 25 to cluster 20,21 is 20. The distance is 5 units. Since 5 is less than 7, 25 joins cluster 20,21 at level 5. But pair 1,3 and pair 7,9 do not join at this level. Merge two clusters if the maximum distance between two clusters is less than or equal to the distance threshold.
The only number not yet joined to some other number is 14. 14 is 11 units away from 25 (which is now part of the 20,21,25 cluster) and it s 7 units away from the 7,9 cluster. So, at level 7, 14 is joined to pair 7,9. The game is played out to form the tree on the right.
The complete-link method tends to create more discrete clusters The single-link method tends to clump things together more. The method you choose determines the results you get. Here are two solutions to the 9-city data:
To me, the complete-link method seems better. Coming from New York, I think of Denver as a western U.S. city, but I ve heard people in San Francisco talk about going back east to Denver for the weekend.
Running MDS and cluster in Anthropac and UCINET You can run these programs in either Anthropac or UCINET. Be sure to specify whether you are analyzing similarities or dissimilarities. Specify the number of dimensions. Most work will be done with 2 dimensions.


")

")


 two")
 two")