Overview of Nepal MPI 2021 and Multidimensional Poverty Peer Network Meeting

S
y
n
o
p
s
i
s
o
f
N
e
p
a
l
M
P
I
2
0
2
1
8
t
h
A
n
n
u
a
l
H
i
g
h
-
L
e
v
e
l
M
e
e
t
i
n
g
o
f
t
h
e
M
u
l
t
i
d
i
m
e
n
s
i
o
n
a
l
P
o
v
e
r
t
y
P
e
e
r
N
e
t
w
o
r
k
(
M
P
P
N
)
4
-
5
O
c
t
o
b
e
r
,
2
0
2
1
H
o
s
t
e
d
b
y
t
h
e
G
o
v
e
r
n
m
e
n
t
o
f
C
h
i
l
e
Presented by:
Dr. Ram Kumar Phuyal
Member
G
o
v
e
r
n
m
e
n
t
o
f
N
e
p
a
l
N
a
t
i
o
n
a
l
P
l
a
n
n
i
n
g
C
o
m
m
i
s
s
i
o
n
5
t
h
O
c
t
o
b
e
r
,
2
0
2
1
P
o
v
e
r
t
y
In simple terms
Poverty
is not having enough material possessions
or
income
for a person's needs.
In other words poverty is the lack of resources to maintain the basic needs of
the individuals. These basic needs are characterized as food, housing, non
food, education, health, entertainment etc.
Poverty is a multifaceted concept, which may include
social
,
economic
,
and
political
elements.
Poverty Measurement Techniques
•
I
n
c
o
m
e
A
p
p
r
o
a
c
h
:
t
h
i
s
a
p
p
r
o
a
c
h
m
e
a
s
u
r
e
s
t
h
e
p
o
v
e
r
t
y
w
i
t
h
t
h
e
i
n
d
i
v
i
d
u
a
l
’
s
i
n
c
o
m
e
i
n
a
r
e
f
e
r
e
n
c
e
p
e
r
i
o
d
g
e
n
e
r
a
l
l
y
i
n
a
d
a
y
.
T
h
e
w
o
r
l
d
B
a
n
k
m
e
a
s
u
r
e
:
t
h
r
e
s
h
o
l
d
o
f
$
1
.
9
/
p
e
r
s
o
n
/
d
a
y
(
t
h
i
s
w
a
s
$
1
/
p
e
r
s
o
n
/
d
a
y
i
n
1
9
9
0
s
)
•
C
o
n
s
u
m
p
t
i
o
n
/
E
x
p
e
n
d
i
t
u
r
e
A
p
p
r
o
a
c
h
:
t
h
e
f
i
r
s
t
m
e
a
s
u
r
e
o
f
p
o
v
e
r
t
y
b
a
s
e
d
o
n
c
o
n
s
u
m
p
t
i
o
n
a
p
p
r
o
a
c
h
w
a
s
d
o
n
e
b
y
C
B
S
i
n
1
9
9
5
/
9
6
b
y
N
e
p
a
l
L
i
v
i
n
g
S
t
a
n
d
a
r
d
S
u
r
v
e
y
(
N
L
S
S
)
w
h
i
c
h
g
a
v
e
t
h
e
p
r
e
v
a
l
e
n
c
e
o
f
h
e
a
d
c
o
u
n
t
i
n
d
e
x
a
s
a
b
o
u
t
4
2
%
.
T
h
e
s
u
b
s
e
q
u
e
n
t
N
L
S
S
I
I
a
n
d
N
L
S
S
I
I
I
g
a
v
e
a
b
o
u
t
3
2
%
a
n
d
2
5
%
r
e
s
p
e
c
t
i
v
e
l
y
.
•
M
u
l
t
i
D
i
m
e
n
s
i
o
n
a
l
A
p
p
r
o
a
c
h
:
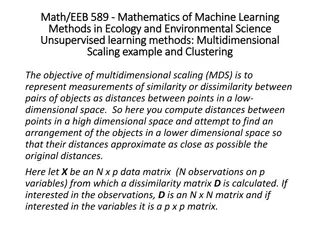
Consumption Poverty in Nepal over the years
M
P
I
i
s
m
a
d
e
u
p
o
f
1
0
i
n
d
i
c
a
t
o
r
s
b
a
s
e
d
o
n
3
d
i
m
e
n
s
i
o
n
s
o
f
d
e
p
r
i
v
a
t
i
o
n
3 dimensions of deprivation are:
Health
Education and
Living Standards
Each dimension is given the same amount of weight i.e. 1/3 or 33.3%
M
P
I
i
s
m
a
d
e
u
p
o
f
1
0
i
n
d
i
c
a
t
o
r
s
b
a
s
e
d
o
n
3
d
i
m
e
n
s
i
o
n
s
o
f
d
e
p
r
i
v
a
t
i
o
n
M
P
I
i
s
m
a
d
e
u
p
o
f
1
0
i
n
d
i
c
a
t
o
r
s
b
a
s
e
d
o
n
3
d
i
m
e
n
s
i
o
n
s
o
f
d
e
p
r
i
v
a
t
i
o
n
W
h
o
i
s
p
o
o
r
?
Anyone deprived in 1/3 or more of the weighted 10 indicators is
multidimensionally poor.
Poverty Cutoff: 33.33%
M
P
I
c
a
l
c
u
l
a
t
i
o
n
The MPI uses the Alkire & Foster (2011) method:
MPI
= H x A
H = Poverty Rate or Headcount ratio
(percentage of people who are poor)
A = Intensity of deprivation
(Average deprivation score among poor people)
S
h
o
w
s
h
o
w
i
n
t
e
n
s
e
p
o
v
e
r
t
y
i
s
!
M
P
I
a
n
d
o
t
h
e
r
m
e
a
s
u
r
e
s
o
f
p
o
v
e
r
t
y
Unidimensional Vs multidimensional measurement of poverty
The MPI complements monetary poverty
The same people may not be identified as poor
MPI also shows how people are poor – the composition of inter
linked deprivations. So it guides multisectoral policy
D
a
t
a
s
o
u
r
c
e
N
e
p
a
l
M
u
l
t
i
p
l
e
I
n
d
i
c
a
t
o
r
C
l
u
s
t
e
r
S
u
r
v
e
y
(
N
M
I
C
S
)
,
C
B
S
/
U
N
I
C
E
F
2
0
1
9
Two stage cluster sample design
53,815 people from 12,800 households
Representative nationally as well as provincial and rural/urban
areas
All 10 indicators of MPI in one single data source
K
e
y
f
i
n
d
i
n
g
s
1
7
.
4
%
o
f
p
e
o
p
l
e
a
r
e
m
u
l
t
i
d
i
m
e
n
s
i
o
n
a
l
l
y
p
o
o
r
(
H
e
a
d
c
o
u
n
t
r
a
t
i
o
)
N
u
m
b
e
r
o
f
p
o
o
r
p
e
o
p
l
e
:
4
.
9
8
m
i
l
l
i
o
n
O
n
a
v
e
r
a
g
e
,
e
a
c
h
p
o
o
r
p
e
r
s
o
n
s
u
f
f
e
r
s
d
e
p
r
i
v
a
t
i
o
n
s
i
n
4
2
.
5
%
o
f
d
i
m
e
n
s
i
o
n
s
(
I
n
t
e
n
s
i
t
y
)
The MPI for Nepal is 0.074
D
e
p
r
i
v
a
t
i
o
n
s
i
n
1
0
i
n
d
i
c
a
t
o
r
s
K
a
r
n
a
l
i
h
a
s
t
h
e
h
i
g
h
e
s
t
p
o
v
e
r
t
y
i
n
c
i
d
e
n
c
e
f
o
l
l
o
w
e
d
b
y
S
u
d
u
r
p
a
s
c
h
i
m
a
n
d
P
r
o
v
i
n
c
e
2
…
39.5
25.3
Lumbini
9.6
7.0
24.2
15.9
18.2
P
r
o
v
i
n
c
e
2
h
a
s
t
h
e
h
i
g
h
e
s
t
n
u
m
b
e
r
o
f
p
o
o
r
p
e
o
p
l
e
a
m
o
n
g
7
p
r
o
v
i
n
c
e
s
(
N
u
m
b
e
r
i
n
t
h
o
u
s
a
n
d
)
T
o
t
a
l
N
E
P
A
L
:
5
0
0
0
D
e
p
r
i
v
a
t
i
o
n
e
x
i
s
t
s
b
e
t
w
e
e
n
r
u
r
a
l
a
n
d
u
r
b
a
n
r
e
s
i
d
e
n
c
e
p
o
p
u
l
a
t
i
o
n
(
I
n
c
i
d
e
n
c
e
o
f
p
o
v
e
r
t
y
%
)
S
i
g
n
i
f
i
c
a
n
t
r
e
d
u
c
t
i
o
n
i
n
p
o
v
e
r
t
y
h
e
a
d
c
o
u
n
t
o
v
e
r
5
y
e
a
r
s
p
e
r
i
o
d
,
N
a
t
i
o
n
a
l
(
%
)
3
.
1
m
i
l
l
i
o
n
p
e
o
p
l
e
l
e
f
t
p
o
v
e
r
t
y
i
n
f
i
v
e
y
e
a
r
s
!
S
i
g
n
i
f
i
c
a
n
t
r
e
d
u
c
t
i
o
n
i
n
p
o
v
e
r
t
y
h
e
a
d
c
o
u
n
t
o
v
e
r
5
y
e
a
r
s
p
e
r
i
o
d
(
2
0
1
4
-
2
0
1
9
)
,
P
r
o
v
i
n
c
i
a
l
(
%
)
F
i
n
a
l
l
y
This report uses a 2019 Nepal MICS dataset. The survey was
completed just before the Covid-19 pandemic in Nepal. So, the
rate might have been changed in the Covid-19 pandemic
context.
F
u
r
t
h
e
r
i
n
f
o
r
m
a
t
i
o
n
a
r
e
a
v
a
i
l
a
b
l
e
i
n
t
h
e
r
e
p
o
r
t
Poverty Headcount, Intensity and MPI:
Level, Trends and Dimensions disaggregated by age,
disability status, place of residence etc.
Please visit the npc web page: www.npc.gov.np
T
h
a
n
k
y
o
u
The 8th Annual High-Level Meeting of the Multidimensional Poverty Peer Network (MPPN) was hosted by the Government of Chile on 4-5 October, 2021. Dr. Ram Kumar Phuyal from the Government of Nepal National Planning Commission presented at the event. The meeting discussed poverty, its measurement techniques like the income, consumption/expenditure, and multidimensional approaches. It also highlighted the evolution of consumption poverty in Nepal over the years. The Multidimensional Poverty Index (MPI) consists of 10 indicators based on 3 dimensions: Health, Education, and Living Standards, each carrying equal weight of 33.3%.

Download Presentation

Please find below an Image/Link to download the presentation.
The content on the website is provided AS IS for your information and personal use only. It may not be sold, licensed, or shared on other websites without obtaining consent from the author. Download presentation by click this link. If you encounter any issues during the download, it is possible that the publisher has removed the file from their server.
E N D
Presentation Transcript
Synopsis of Nepal MPI 2021 8th Annual High-Level Meeting of the Multidimensional Poverty Peer Network(MPPN) 4-5 October, 2021 Hosted by the Government of Chile Presented by: Dr. Ram Kumar Phuyal Member Government of Nepal National Planning Commission 5th October, 2021
Poverty In simple terms Poverty is not having enough material possessions or income for a person's needs. In other words poverty is the lack of resources to maintain the basic needs of the individuals. These basic needs are characterized as food, housing, non food, education, health, entertainment etc. Poverty is a multifaceted concept, which may include social, economic, and political elements.
Poverty Measurement Techniques Income Approach: this approach measures the poverty with the individual s income in a reference period generally in a day. The world Bank measure: threshold of $1.9/person/day (this was $1/person/day in 1990s) Consumption/Expenditure Approach: the first measure of poverty based on consumption approach was done by CBS in 1995/96 by Nepal Living Standard Survey (NLSS) which gave the prevalence of head count index as about 42%. The subsequent NLSS II and NLSS III gave about 32% and 25% respectively. Multi Dimensional Approach:
Consumption Poverty in Nepal over the years Sector 1995/96 2003/04 2010/11 Nepal 41.76 30.85 25.16 Urban 21.55 9.55 15.46 Rural 43.27 34.62 27.43
MPI is made up of 10 indicators based on 3 dimensions of deprivation 3 dimensions of deprivation are: Health Education and Living Standards Each dimension is given the same amount of weight i.e. 1/3 or 33.3%
MPI is made up of 10 indicators based on 3 dimensions of deprivation Dimension/ Weight Indicator Weight Household is deprived if Any child for whom there is nutritional information is undernourished in terms of weight for age (underweight) or height-for-age (stunting) 1/6 Nutrition Health (1/3) A child under 18 has died in the household in the five- year period preceding the survey Child Mortality 1/6 No household member aged 11 years or older has completed 6 years of schooling Years of Schooling 1/6 Education (1/3) Any school-aged child is not attending school up to the age at which he /she would complete class 8 School Attendance 1/6
MPI is made up of 10 indicators based on 3 dimensions of deprivation Dimension/ Weight Indicator Weight Household is deprived if Cooking Fuel The household cooks with dung, wood, or charcoal Improved Sanitation improved but shared with other households Improved drinking water minute walk from home, roundtrip Electricity The household has no electricity The household has inadequate housing materials in any of the three components: floor, roof, or walls The household does not own more than one of these assets: radio, TV, telephone, computer, animal cart, bicycle, motorbike, or refrigerator, and does not own a car or truck 1/18 The household s sanitation facility is not improved, or it is 1/18 The household does not have access to improved drinking water or safe drinking water is at least a 30- 1/18 Living Standards (1/3) 1/18 1/18 Housing Assets ownership 1/18
Who is poor? Anyone deprived in 1/3 or more of the weighted 10 indicators is multidimensionally poor. Poverty Cutoff: 33.33%
MPI calculation The MPI uses the Alkire & Foster (2011) method: MPI = H x A H = Poverty Rate or Headcount ratio (percentage of people who are poor) A = Intensity of deprivation (Average deprivation score among poor people) Shows how intense poverty is!
MPI and other measures of poverty Unidimensional Vs multidimensional measurement of poverty The MPI complements monetary poverty The same people may not be identified as poor MPI also shows how people are poor the composition of inter linked deprivations. So it guides multisectoral policy
Data source Nepal Multiple Indicator Cluster Survey (NMICS), CBS/UNICEF 2019 Two stage cluster sample design 53,815 people from 12,800 households Representative nationally as well as provincial and rural/urban areas All 10 indicators of MPI in one single data source
Key findings 17.4% of people are multidimensionally poor (Headcount ratio) Number of poor people: 4.98 million On average, each poor person suffers deprivations in 42.5% of dimensions (Intensity) The MPI for Nepal is 0.074
Deprivations in 10 indicators 16.2 20 16.2 18 16 Percentage of Population Poor and Deprived 11.6 10.3 14 9.3 12 10 6.5 5.5 8 3.5 6 2.7 4 0.9 2 0 School Attendance Water Assets Electricity Nutrition Years of Schooling Cooking Fuel Housing Sanitation Child Mortality Health Education Living Standards
Karnali has the highest poverty incidence followed by Sudurpaschim and Province 2 39.5 25.3 9.6 Lumbini 18.2 7.0 15.9 24.2
Province 2 has the highest number of poor people among 7 provinces (Number in thousand) 1296 1400 1200 958 1000 773 800 636 631 600 470 400 227 200 0 Gandaki Bagmati Sudurpaschim Karnali Province 1 Lumbini Province 2 Total NEPAL: 5000
Deprivation exists between rural and urban residence population (Incidence of poverty %) 30 28.0 25 20 15 12.3 10 5 0 Rural Urban
Significant reduction in poverty headcount over 5 years period, National (%) 35 30.1 30 25 17.4 20 15 10 5 0 2014 2019 3.1 million people left poverty in five years!
Significant reduction in poverty headcount over 5 years period (2014-2019), Provincial (%) 60 50.9 49.1 50 39.5 40 32.5 31.2 30 25.3 24.2 21.3 18.5 18.2 15.9 20 14.4 9.6 7.0 10 0 Province 1 Province 2 Bagmati Gandaki Lumbini Karnali Sudurpaschim
Finally This report uses a 2019 Nepal MICS dataset. The survey was completed just before the Covid-19 pandemic in Nepal. So, the rate might have been changed in the Covid-19 pandemic context.
Further information are available in the report Poverty Headcount, Intensity and MPI: Level, Trends and Dimensions disaggregated by age, disability status, place of residence etc. Please visit the npc web page: www.npc.gov.np Thank you